Unanswered [0] | Urgent [0]
  

Home / Writing Feedback   % width   Posts: 8


IELTS TASK 1: BAR CHARTS- Married and Divorced in the USA


leoking 7 / 24  
Feb 8, 2014   #1
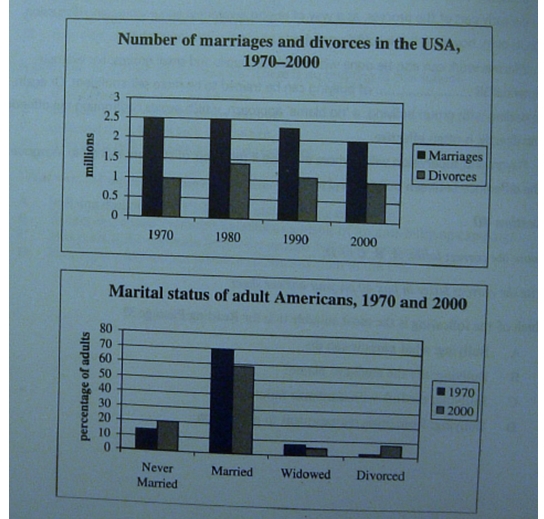
The charts below compare data about the number of people who were married and divorced in the USA over a period of 30 years, and the marital status of American adults in the year 1970 and year 2000.

It is clear that the gap between the number of married couples and divorced couples became closer throughout the period. Also, the rate for people who never married and divorced had increased by 2000, while the rate of married people and widowed people had experienced a decline by 2000.

The year 1970 had the highest gap between the number of married couples and divorced couples, with 2.5 million and 1 million respectively. From this time onwards, the gap stared to reduce. In 2000, the figure for marriages hit to the bottom point at 1 million, while the number of divorces remained unchanged at 1 million.

By 2000, the rate for never married adults and divorced adults had increased, from approximately 12 percent to 20 percent and nearly 2 percent to almost 7 percent respectively. The rate for divorce more than tripled in 2000. However, the rate for married couples and widowed people declined, to just under 60 percent and approximately 5 percent respectively in 2000.

  • 3602014020915450.jpg


dumi 1 / 6795  
Feb 9, 2014   #2
It is clear that the gap between the number of married couples and divorced couples became closeRhad been narrowed throughout the period.

Well, these are my major observations for the overview;
Overall, there had been a downward trend for marriages while the divorces had shown an upward trend. However, the difference between the married couples and the divorced couples had recorded a decline towards the year of 2000.
OP leoking 7 / 24  
Feb 9, 2014   #3
hello dumi, thanks for your correction, how about second graph, do i need to write an overview about second one as well?
MisterWandering 18 / 314  
Feb 9, 2014   #4
do i need to write an overview about second one as well

Yes, I think you should describe the main trends of both two charts in the overview paragraph.
Overall, the number of marriages was significantly higher than the number of divorces over the period. Also, the majority of American people were married in both given years, 1970 and 2000.

The charts below compare data about the number of people who were married and divorced in the USA over a period of 30 years, and the marital status of American adults in the year 1970 and year 2000.

I don't think you should use the word "below" in the introduction. This is because when you write on the exam paper, there is no chart/graph below your essay.
dumi 1 / 6795  
Feb 9, 2014   #5
hello dumi, thanks for your correction, how about second graph, do i need to write an overview about second one as well?

No, there is no need for two separate overviews. You need to sum up your observations and present in one. So, pick up most obvious trends or observations from both and present them in one overview para. This same rule applies to all sections of your answer. :)

Follow the structure I provided in your other thread :)
Pahan 1 / 1824  
Feb 9, 2014   #6
I think you have a good understanding about the structure for this task. However, I wish you did a little more work with your body paragraphs that give the details. Let's take the first para for example;

The year 1970 had the highest gap between the number of married couples and divorced couples, with 2.5 million and 1 million respectively. From this time onwards, the gap stared to reduce. In 2000, the figure for marriages hit to the bottom point at 12 million, while the number of divorces remained unchanged at 1 million.

Here, you should have talked a bit more about the trends. The most obvious trend in this graph is that the continuous drop number of marriages. So you could have mentioned that with figures. Also, be careful not to make any errors with figures, because figures matter a lot in report writing :D
eddies [Contributor] 25 / 1170  
Feb 9, 2014   #7
Well, these are my major observations for the overview;

Yes, I agree with Dumi. Presenting an overview with main trends (diversities or sameness) should be clear. This will bring you have a great point on Task Achievement. (See IELTS Writing Band Descriptors).

The rate for divorce more than tripled in 2000

Missing a verb has been detected here.

the rate of married people and widowed people had experienced

To me, your writing is good. Pay particular attention to your grammatical mechanics. Good luck :)
OP leoking 7 / 24  
Feb 10, 2014   #8
hello pahan, i totally agree with you, i do want to describe more detail about the downward trend of marriages. but i concerns about the i may write over words and waste some time on the exam. could you show me how you will write this in detail


Home / Writing Feedback / IELTS TASK 1: BAR CHARTS- Married and Divorced in the USA
Do You Need
Academic Writing
or Editing Help?
Need professional help with your assignments? Fill out one of these forms:

Graduate Writing / Editing:
GraduateWriter form ◳

Best Essay Service:
CustomPapers form ◳

Excellence in Editing:
Rose Editing ◳

AI-Paper Rewriting:
Robot Rewrite ◳