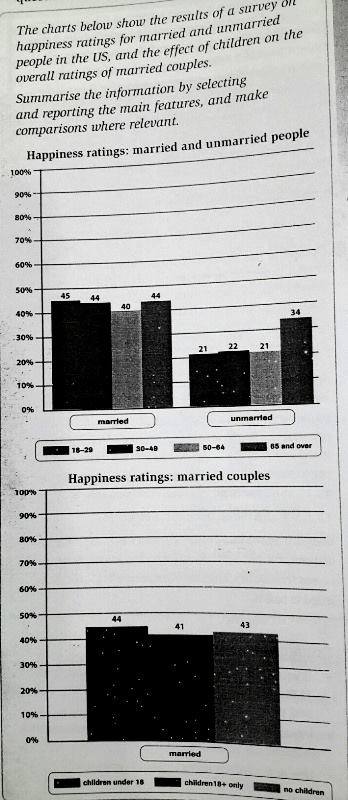
The bar charts present the data of the proportion of happiness level of residents aged 18 to over 65 and the families who have children or not in United States. Overall, it is justified to say that, the married people is found happier than the unmarried, while couples experience similar rating from them who have children or not.
In the first chart, people in the 18-29 age group already in a marriage, experience the highest percentage at 45% rather than those who between 50 and 65 of age by only 40 percent. On the other side, they who in the 30-49 and 65 and over age group witness the equal rating 44%. However, the unmarried citizens find less pleased with their life, with greatest level is only 34 percent which is witnessed by they who at the age of 65 and over, while the youngsters are in the lower level at around 21% - 22%.
Focus on the married couples, the second bar chart describes that, they who all of the children have aged over 18 years are 2% lower, compare with those who do not have children at 41% and 43% respectively. On the other hand, there are 44% of the couples who experience blissfulness by having children at the age under 18 years old.

12650400_10842531549.jpg
