Unanswered [6] | Urgent [0]
  

Home / Writing Feedback   % width   Posts: 4


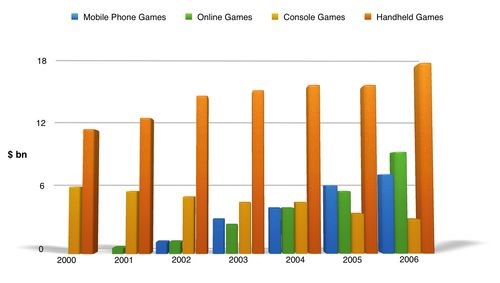
The bar graph shows the global sales of different types of digital games between 2000 and 2006.


Okapi99 2 / 2  
Jul 9, 2018   #1

sale of four types of digital games


The bar graph compares the global sales based on the sales of four types of digital games from 2000 to 2006.

It is clear that the handheld games were the most popular games, and the online game increased a lot in the period.

A close look reveals that in 2000, handheld games stood at around 10 billion pounds and had an upward trend, and hit a peak at just under 18 pounds in 2006, while the sales of console games were just around half as many as that of handheld games. In the over following five years, the sales of console games experienced a downward trend, and hit its low point at roughly 3 billion pounds in 2006, which was the lowest level of sales out of four digital games. Interestingly, the data of the sales of online games was not shown until in 2002 at approximately 2 billion pounds, which was the lowest level in this year out of four games. However, the sales of online games increased gradually and reach a high at about 9 billion pounds in 2006. Its sales were the second highest level in 2006.

  • 1.jpg


thuhuyen461 5 / 6  
Jul 9, 2018   #2
My supplementary corrections:
...In the over During the following five years,
...hit its low point/bottom at roughly 3 billion pounds dollars in 2006,
Interestingly, the data of the sales of online games revenue
...2 billion pounds dollars
... the lowest level in this year out of four games of all types in this year.
... reached a high summit at
OP Okapi99 2 / 2  
Jul 10, 2018   #3
Thank you.

I am going to tweet it.
Holt  Educational Consultant - / 15393  
Jul 10, 2018   #4
Tapir, the overview summary needs to be at least 3 sentences long. You do not have a complete prompt overview in this instance. The examiner will be looking for the following information in the summary paragraph:

1. Type of chart
2. Games for comparison
3. Measurement type (billions)
4. Years covered (2000-2006)
5. Trending statement

Follow the above format for all the Task 1 type essays of the chart comparison kind when presenting the summary overview.

There is a distinct possibility that this essay can receive a failing score because, although you presented more than 150 words, you are presenting the information in a single paragraph composed purely of run-on sentences. Divide the information into more readable paragraphs of 3-5 sentences each in order to make the essay easier to read and also, cause less stress for the reader who needs to understand what you wrote and take note of important discussion and comparison points.

The information you provide is incomplete. You must present the information on a per bracket basis (2000-2003, 2003-2006) and then focus on 2004 in a separate paragraph because of the equal line comparison point for mobile phone and online games. Remember, graph charts always require comparison points as part of the analytical report.


Home / Writing Feedback / The bar graph shows the global sales of different types of digital games between 2000 and 2006.
Need Writing or Editing Help?
Fill out one of these forms:

Graduate Writing / Editing:
GraduateWriter form ◳

Best Essay Service:
CustomPapers form ◳

Excellence in Editing:
Rose Editing ◳

AI-Paper Rewriting:
Robot Rewrite ◳

Academic AI Writer:
Custom AI Writer ◳