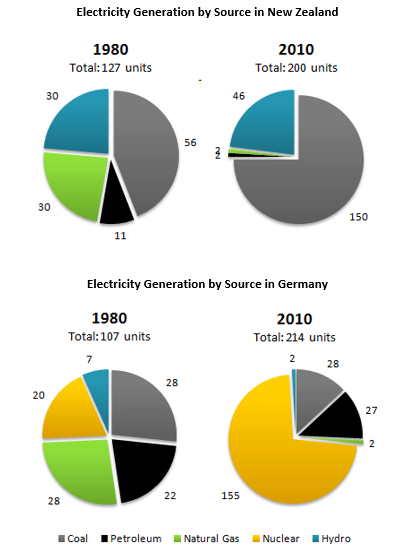
The pie charts below show electricity generation by source in New Zealand and Germany in 1980 and 2010.
A breakdown of the figure for generating electricity with many sources in New Zealand and Germany in 1980 and 2010 is shown in the pie charts. Overall, it can be seen that the units of both countries increased significantly, even though there was a difference in electricity they used.
In 1980, coal was used to generate the electricity, having 56 of the total 127 units, increasing to 150 of the total 200 units in 2010. However, there was a difference in Germany which they mostly depended on nuclear power plant with 155 out of 214 units in 2010.
Hydropower also became the second largest electricity source in 2010 although, in France, hydro-power lost the usage falling from 7 to 2 units. Both countries, however, did not depend anymore on natural gas, indicated by 2 percent for both. The same condition happened to coal electricity source in New Zealand, but in Germany, it increased to 27 in 2010.
(157 Words)

atugas2.png
