number of goods transported in the united kingdom
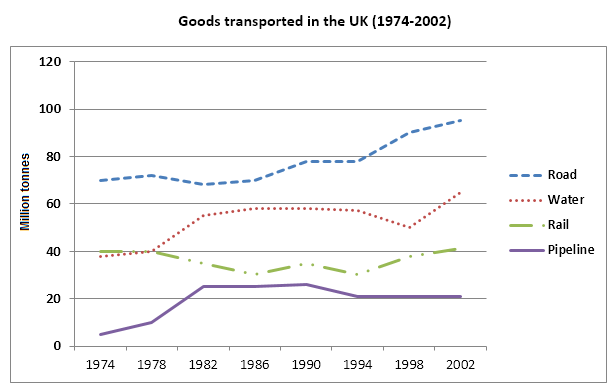
The graph below shows the quantities of goods transported in the UK between 1974 and 2002 by four different modes of transport
The line graph provides the breakdown of the figures of commodities which were transported by various vehicles in the UK over the period of 28 years, commencing from 1974. Generally speaking, it can be seen from the chart such modes as road and water were put on agenda, while individuals, showed less interest in others.
To specify, as can be observed from the statistics, initially in 1974, more than 70 million tonnes of products were transported via road while water and rail shared the nearly same amount of goods, approximately 40 million tonnes. The least quantity of goods transported by pipeline started at a negligible point in the same year. The next 20 years were noticing fluctuation before experiencing a substantial increase, at roughly 90 million tonnes by road, then it reached the high at about 100 million tonnes. It is interesting to note that the same trend was true for both water and rail goods carrying. Water shipping had distributed about 62 million tonnes by 2002. Although the figure of goods carried through rail was falling significantly to 30 million tonnes from 1974 to 1994, it bouced back to approximately 42 million tonnes in 2002
Finally, there was a substantial growth in the amount of goods transported by pipeline, between 1974 to 1994, to roughly 22 million tonnes, then this figure was levelling off from 1994 to 2002

goodstransportedin.png
