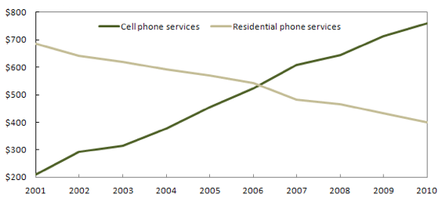
A breakdown of standard yearly spending on mobile phone and landline phones in US from 2001 to 2010, a 9 year period is illustrated in the line chart. Overall, while over 10 years the amount of money spent on cell phones increased dramatically, the average expenditure on stationary phones decreased significantly.
There were some changes in expenditure over the following 5 years. While average's sell of residential phone services in 2001 under $700, Americans only bought cell phone services at the same time at about $200 which was the lowest figure in this question period. The following year, the landline phone disposals fell slightly to $650, but the selling of mobile phone rose steadily to $300. Interestingly, both phones experienced a same rate in consumers' expenditures at more than five hundred dollars in 2006.
A more detailed looking at the chart reveals that the significant changes in the last 5 years. Both categories (mobile and landline phones) explained a dramatic decrease and increase to under $500 and above $600 repetitively in 2007. In contrast, while all items altered slowly, the first figure rose significantly to $750 which was the highest proportion yearly spending and another item dropped down to $400.

expanditure_of_US_co.png
