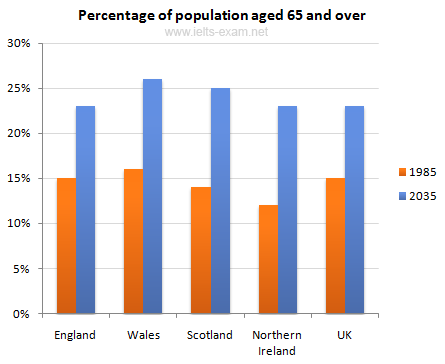
The graph chart illustrates the percentage of British who are from 65 and older between 1985 and 2035, measured in percentage.
The graph shows that in 1985, that both in UK and England, the percentage of population with age 65 and higher were equal to 15% respectively. In parallel, Scotland and Northern Ireland were considered to be the lowest with their percentage of 14% and 12%. The most salient in the graph, Wales managed to reach 16%.
According to the graph chart there will be a significant vicissitude when it comes to the percentage of all territory in 2035, it betokens that England and UK's percentage will be increased by approximately 8 % each. In the meantime, Scotland will increase it percentage for 11 %, while this value will be 2,5 % larger than the future Northern Ireland one's. Wales as usual will be leading with its remarkable 26%.
The data suggests that, as time goes by, British people are becoming more salubrious and that phenomena will prolong their life span.

IELTS_Writing_Task_1.png
