monthly spend on children's sports
The first chart below gives information about the money spent by British parents on their children's sports between 2008 and 2014. The second chart shows the number of children who participated in three sports in Britain over the same time period.
Summarise the information by selecting and reporting the main features and make comparisons where relevant.
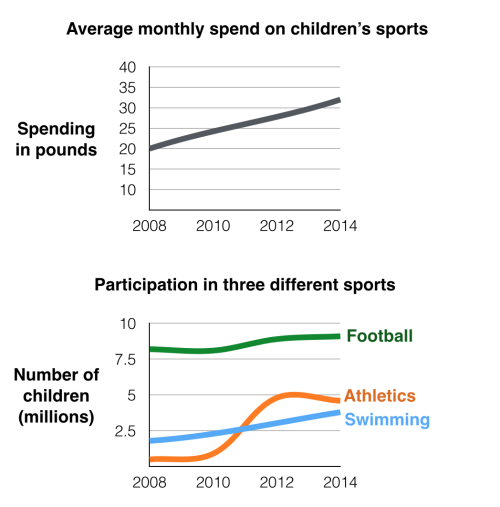
The first line graph demonstrates the expenditure on adolescent's sporting activities monthly by British parents during the 2008-2014 period, whereas the second one indicates the number of young children taking part in three sports, namely football, athletics and swimming during the aforementioned period.
As can be seen clearly from these given charts, the amount of money utilized for sports tend to increase gradually throughout the years. In addition, football and athletics remained unchanged during the 2008 - 2010 period and 2012 - 2014 period.
To start with the first graph, parents spent 20 pounds per month for their children's sports in 2008 per month. After that, there was a growth in the amount of monetary spending by 5 pounds to 25 pounds in the next two years, which led to another rise to roughly 27 pounds every month in 2012. Finally, the budget for juvenile's sports reached over 30 pounds per month in 2014.
Moving to the second graph, the number of teenagers engaging in football and athletics leveled off from 2008 to 2010, with over 7,5 million children and about 1 million children respectively. While athletics witnessed an escalation to 5 million children playing in 2010, football underwent a slight increase to 8 million teenage children taking part in simultaneously. Both aforementioned datas remained stable in the last two years of the period. As for the swimming figure, there was a gradual upward from 2008 to 2014, from below 2,5 million juveniles to approximately 3 million juveniles.

RAT2PT31.png
