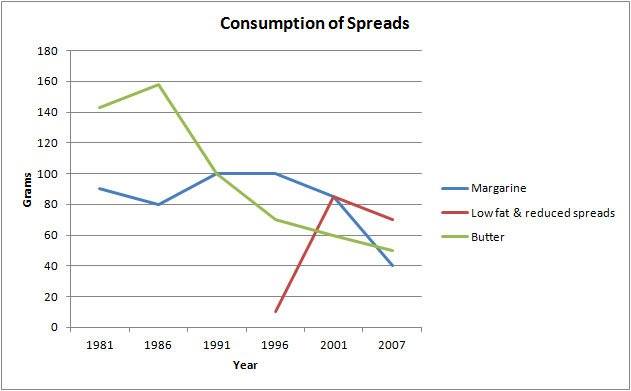
The line graph illustrates the amount consumed of 3 spreads since 1981 until 2007.
It is noticeable that at the first butter was the most common consumption of three spreads but it decreased dramatically at the last period. However, a considerable rise can be seen in the consumption of low fat & reduced spreads.
Between 1981 and 1986, butter consumption rose from around 140 to 160 grams. In spite of 1986 until 2007, its spread had plummeted drastically to around 50 grams. On the other hand, in the figure for margarine fluctuated between 80 to 90 grams in 1981 to 2001 but it also dropped from around 85 to 40 grams in 2007.
By contrast, in 1996 low fat & reduced spreads came as a new spread and it had doubled since 2001 to approximately around 10 to 85 grams. Nevertheless, few decrement also happened in 2007 from around 85 to 70 grams.

Day_1_Writing_task..jpg
