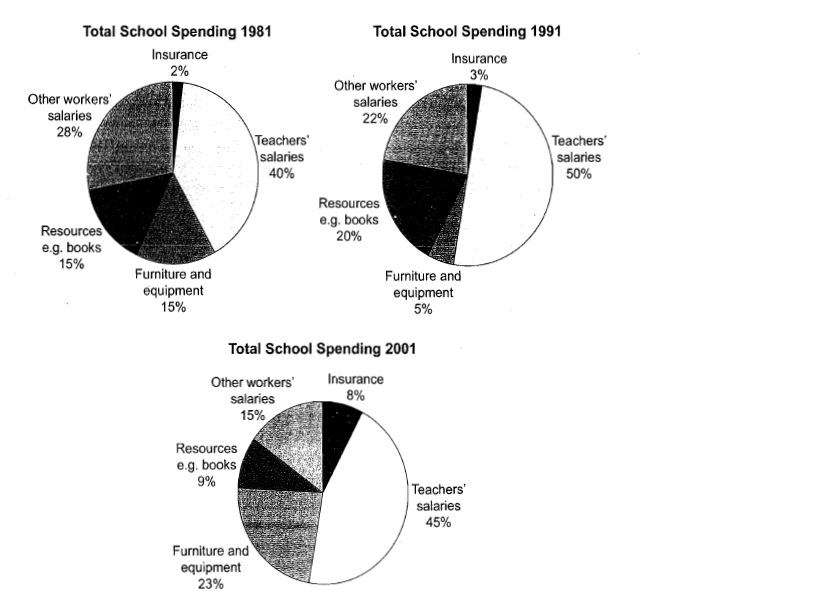
This three pie charts show the changes in annual spending by a particular UK school in 1981, 1991, and 2001.
The pie charts compare the number of spending in 1981, 1991 and 2001 at particular UK school. Overall, it can be seen that the total spending of teacher salary, furniture and equipment fluctuated in 3 years period, although there was small rose from 1991 to 2001. Spending for other workers salary and resources were decrease. And the total of spending insurance was gradual increase.
In 1981, the percentage of spending teacher salary stood at 40 percent, buying books were began 15 percent, insurance 2 percent , furniture and equipment as much as 15 percent and salary of other workers was 28 percent.
There was a large rise in total of spending teacher salary and resources like books in 1991 as much as 50% and 20%. However, this percentage was bigger than I 2001, where was the percentage slight rise 45 and 9. While spending of insurance rose 3 percent and this percentage smaller than 2001, where was 8 percent. On the other hand, buying furniture and equipment saw a dramatic jump from 1991 to 2001 at 5% to 23%. And then in 3 years period declined gradually between 1991 and 2001, where was 28 percent to 23 percent and the end 15 percent.

289548_1_o.jpg
