Unanswered [3] | Urgent [0]
  

Home / Writing Feedback   % width   Posts: 5


[IELTS TASK 1] CAMBRIDGE 12 - BAR CHART - PHYSICAL ACTIVITIES


hailung 6 / 18  
Aug 7, 2017   #1
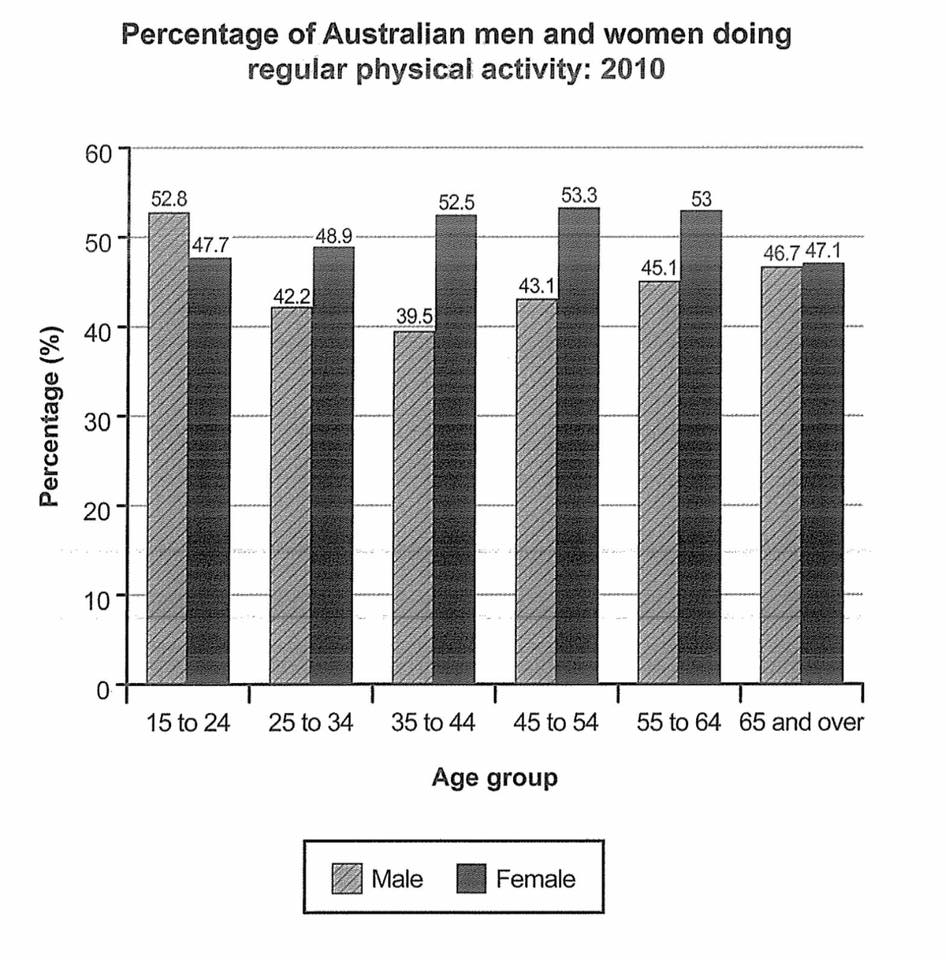
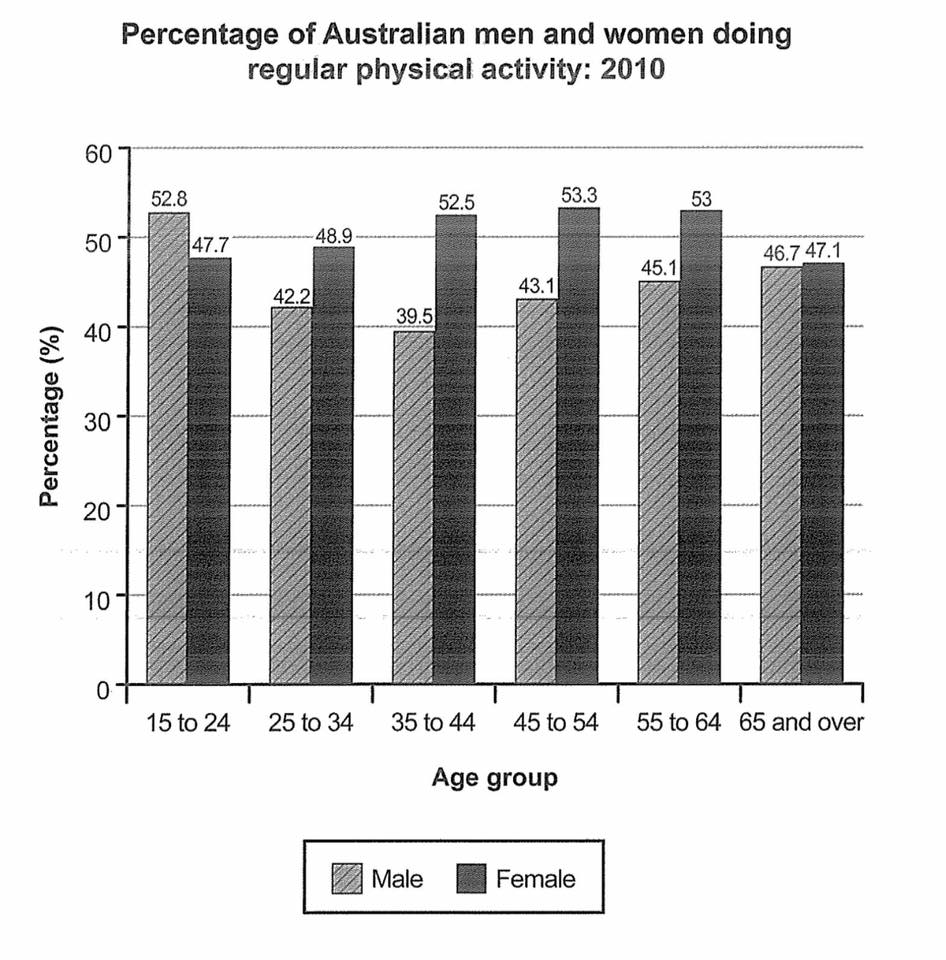
The bar chart below shows the percentage of Australian men and women in different age groups who did regular physical activity in 2010

Please help me as I couldn't figure the similarities and differences between two values to make comparison. Thank

PHYSICAL ACTIVITIES at all age


The bar chart compares the percentage of male and female in Australia in six distinct age groups who took part in regular physical exercises in 2010.

It is clear that Australian men exercised more when they got older while their female counterparts lost their interest in such activities over the same period of time.

Men aged 15-24 spent the biggest proportions on exercises at 52.8 percents. The figures then declined to only 39.5 percents for 35-44 age group before gradually increased into 46.2 percents, which was the lowest figures of group aged 65 and above.

The majority of women, on the other hand, showed great interest in physical activities. While only 47.7 percents of female aged 15-24 involved in physical sports, the figures for other older groups saw a gradual rise and peaked at 53.3 percents, which was the figures for women in their middle-forties to early fifties. Only 47.1 percents of female aged 65 and above considered doing exercises on a regular basic.

  • a1.jpg


Holt  Educational Consultant - / 15393  
Aug 7, 2017   #2
Kenzin, there are no similar images in the bar chart that you were provided. Which is why you could not find any similar percentages to compare in your essay. When there are no similar information to compare, you don't have to force yourself to make a comparison. A discussion of the trend in measurements would be more appropriate in such as instance.

Please remember to complete 3 sentences per paragraph in order to gain a higher C&C score as the completeness of your paragraph is a major consideration in gaining higher points in that section of the test. In this instance, you could have done a better job in summarizing the essay information in order to make it a stronger contender for a higher TA score. You should have indicated that the measurements were in percentage form and then ended with the age groups being charted in the graph. A comment regarding the trend in measurements would have also helped create a better overview of the content.

Then, you could have combined the information in the second and third paragraphs to create a more informative second paragraph. The Task 1 essay is acceptable as long as it has 3-4 paragraphs in it so your essay would have fallen into the minimum requirement had you done a better presentation of the summary at the start.
smvicp 3 / 4  
Aug 8, 2017   #3
your sentences are short and your paragraph includes 1 or 2 sentences so this makes your paragraph very short.
make a better overall for your essay.
OP hailung 6 / 18  
Aug 8, 2017   #4
@Holt

Thank you Holt again for your kind comment.
OP hailung 6 / 18  
Aug 10, 2017   #5
Merged:

[IELTS TASK 1 - EDITED] IELTS CAMBRIDGE 12 - TEST 5 TASK 1


The bar chart shows the percentage of Australian men and women in different age groups who did regular physical activity in 2010

I edited my writing according to your remark. So please help me with this new piece of writing HOLT

The bar chart compares men and women of different ages in Australia who exercised physically on a regular basic in 2010.

Overall, it is clear that the proportions of female who took part in some forms of workout is far higher among younger groups, while the oldest one is least likely to exercise. On the contrary, men are most active at their earliest ages and their interests towards such healthy activities increase as they get older.

Men aged 15-24 was the most active group as 52.8% of them did exercise regularly. In the next two decades, only 42.2% and 39.5 men paid interests in such activity, respectively. The figures rose gradually for men in their late-thirties to the 65 and over age group.

47.7% of women aged 15-24 spent time doing physical exercise. There was a steady increase in the number of women did these activities in the next 20 years. The figures for women aged 45-54 and 55-64 were almost the same, at about 53%. The oldest group was prone to other activities rather than doing exercises as the figures for this group was the lowest at 47.1%, which was virtually the same as 15-24 age group.

(198 words)


  • a1.jpg


Home / Writing Feedback / [IELTS TASK 1] CAMBRIDGE 12 - BAR CHART - PHYSICAL ACTIVITIES
Need Writing or Editing Help?
Fill out one of these forms:

Graduate Writing / Editing:
GraduateWriter form ◳

Best Essay Service:
CustomPapers form ◳

Excellence in Editing:
Rose Editing ◳

AI-Paper Rewriting:
Robot Rewrite ◳

Academic AI Writer:
Custom AI Writer ◳