Topic:
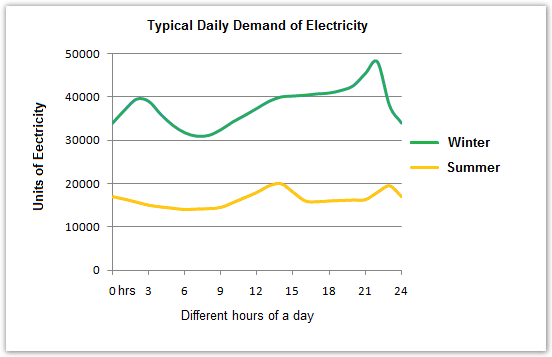
The graph below shows the demand for electricity in England during typical days in winter and summer.
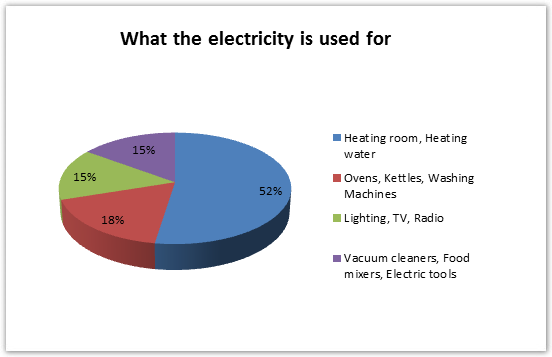
The pie chart shows how electricity is used in an average English home.
My essay:
The line graph compares the daily amount of electricity was used in winter and in summer of England, and the pie chart illustrates how four different uses of electric power are used in a typical English home. The pie chart illustrates how electricity power was used for four different ways in a typical English home.
It is clear that more power was used in winter than in summer. The electricity used for heating rooms and water is the highest among all of the four categories. The daily electricity demand for winter, about 30,000 to 45,000 units, is approximately twice as that for summer, which is between 10,000 and 20,000 units.
According to the line graph, in winter, English uses the most power, reaching over 40,000 units, on 22nd hour. While in summer, the line reaches its peak barely at 20,000 units, which is on its 14th hours. However, the lowest units for winter are slightly over 30,000 units and for summer are about 14,000 units, and both of them fall on similar hours, 8th and 9th respectively.
Looking at the pie chart, in an average English home, we can see that they used over half of the electricity, 52.5%, on heating rooms and water. The other uses are all for electrical devices, 17.5% of power using are for kitchen facilities, such as ovens, kettles, and washing machines, and 15% for each of the other two categories: lighting, TV, and radio, and vacuum cleaners, food mixers, and electric tools.
The graph below shows the demand for electricity in England during typical days in winter and summer.
The pie chart shows how electricity is used in an average English home.
Summarise the information by selecting and reporting the main features and make comparisons where relevant.
My essay:
The line graph compares the daily amount of electricity was used in winter and in summer of England, and the pie chart illustrates how four different uses of electric power are used in a typical English home. The pie chart illustrates how electricity power was used for four different ways in a typical English home.
It is clear that more power was used in winter than in summer. The electricity used for heating rooms and water is the highest among all of the four categories. The daily electricity demand for winter, about 30,000 to 45,000 units, is approximately twice as that for summer, which is between 10,000 and 20,000 units.
According to the line graph, in winter, English uses the most power, reaching over 40,000 units, on 22nd hour. While in summer, the line reaches its peak barely at 20,000 units, which is on its 14th hours. However, the lowest units for winter are slightly over 30,000 units and for summer are about 14,000 units, and both of them fall on similar hours, 8th and 9th respectively.
Looking at the pie chart, in an average English home, we can see that they used over half of the electricity, 52.5%, on heating rooms and water. The other uses are all for electrical devices, 17.5% of power using are for kitchen facilities, such as ovens, kettles, and washing machines, and 15% for each of the other two categories: lighting, TV, and radio, and vacuum cleaners, food mixers, and electric tools.

line graph
pie chart
