Cambridge 1 Writing Task 1
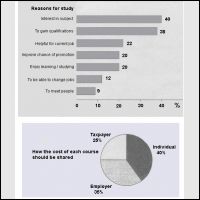
The charts below show the results of a survey of adult education. The first chart shows the reasons why adults decide to study. The pie chart shows how people think the costs of adult education should be shared.There are two kinds of information given in the charts below. The first chart depicts reasons for getting education by adult people. The second one illustrates the percentage of distributed considering expenditure on education. Both charts will be analyzed before conclusion is shown.
According to the survey, majority of adults were interested in subject, the percentage of that was 40. Similar quantity (38%) belonged to the adults, who saw usefulness of education in gaining qualifications. Whereas, others preferred to think that education was helpful for their current jobs (22%). To improve prospects of promotion and enjoy learning/studying took the same percentage place, which was approximately near previous shown cause. A few percent of adults (12%) decided to study for being able to change jobs. At last, minority of adults (9%) were convinced that getting education was worth because of meeting people.
As we can see from the pie-chart, distributing of money has such picture. 40% of mentioned amount would go to individuals, which was only 5% more than employers' payment. The fewer sums should go to taxpayers, the percentage of that was estimated 25%.
Thus, from the observation, we can conclude our thoughts like this: many people were persuaded to get education because of subjects; average of them would like to improve their professions, positions and studying quality. Whilst, there were some adults, who would use education to find more suitable jobs or meet new people. The expenditure on education by the adults was divided into three parts.

210521_1.jpg
