You should spend about 20 minutes on this task.
The graph and table below give information about water use worldwide and water consumption in two different countries
Summarise the information by selecting and reporting the main features and make comparisons where relevant
Write at least 150 words.
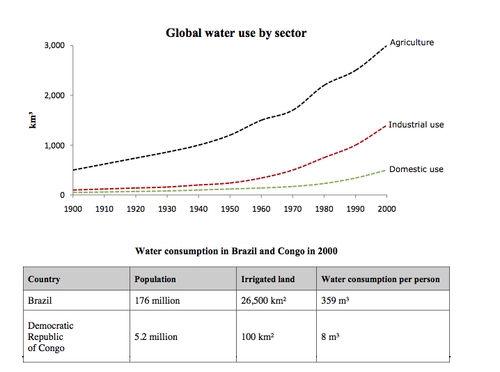
The graph shows the global water use by different sectors from 1900 to 2000 and the table presents the caparison of water consumption between Brazil and Congo.
From the graph, it can be found that the water use in agriculture, industrial use and domestic use and the in all the three sectors increased during the 19s. In 1900, the water use in agriculture was about 500 dm3 and sharply climb to 3000 dm3 in 2000, while the industrial use and domestic use remain stable at a very low amount until around 1950 they start to rise up. In 2000, industrial use and domestic use were approximately 1000 dm3 and 300 dm3 respectively.
The table presents the water consumption of agriculture in Brazil and Democratic Republic of Congo. Brazil with a larger population of 176 million irrigated 26500 km2 land and the water consumption per person was 359 m3 in 2000. In contrast, the irrigated land of the D.R.C was 100 km2 and its population was 5.2 million, also the water consumption per person was much lower than that in Brazil which is 8 m3.

205849_1_o.png
