fast food consumption by australian adolescents
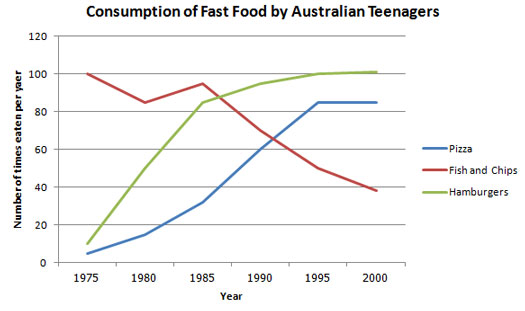
IELTS writting task 1: The line graph below shows changes in the amount and type of fast food consumed by Australian teenagers from 1975 to 2000.
Summarize the information by selecting and reporting the main features and make comparisons where relevant. Write at least 150 words.
The line graph given illustrates how often Australian adolescents consumed three types of fast food, as measured by the number of times eaten per year, from 1975 to 2000. Overall, pizza, once the most consumed fast food, lost favor with Australian teenager. By comparison, the period given saw a sharp increase in the consumption of fish and chips, and hamburgers.
Pizza, which Australian adolescents ate as high as 100 times per year in 1975, saw slight downward fluctuations until 1985, after which it was in sharp decline. It was overtaken by hamburgers in the late 1980s and by fish and chips in the early 1990s. In 2000, the consumption of pizza fell below 40 times per year.
By contrast, the consumption of hamburgers, and of fish and chips, which was well below 20 times per year each, experienced a dramatic rise, albeit at different rates. The former soared to over 80 times per year in 1985 and then rose steadily to minimally more than 100 times per year in 2000, while the latter increased at a considerable rate before leveling off at over 80 times per year from 1995 and 2000. Noteworthily, throughout the period given, Australian adolescents always ate hamburgers at higher frequencies than fish and chips.
---
I just saw Holt advocate for the three paragraph task 1 essay so I try to write such one. Hope it works out well.

xieltstask1fastf.jpg
