expedintures in a british school
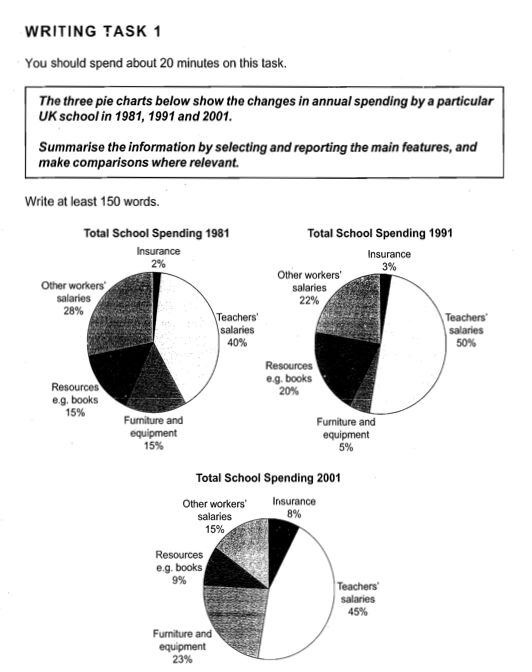
A breakdown of information concerning the proportion of money (in percentage) spent on a particular school in the United Kingdom in three different years selected (1981, 1991 and 2001) is exhibited in the pie charts. It is noticeable that teachers' salaries, furniture and equipment, and insurance showed an ascending trend, while other workers' salaries and resources witnessed a descending trend. In addition, the school in UK spent more on teachers' salaries compared to other expenditures, while insurance had the smallest percentage of expenditure.
A more detailed look at the charts reveals that approximately 40% money was allocated to teacher budget in 1981, and this number showed the largest proportion compared to other budget. The number increased slightly after reaching a peak of a half percentage in 199, rising to 45% in 2001. Furthermore, Furniture and insurance expenditure inclined gradually, the former rose from 15% to 23%, while the latter climbed by 6% between 1981 and 2001. In stark contrast, the figure for Insurance is responsible to the lowest proportion over the period.
Moving to the rest expenditures, two figures witnessed a downward trend. Figure for other workers' salaries showed a gradual decrease, declining from 28% to 15%. Similarly, the figure for books budget went down gradually between 15% and 9% from 1981 to 2001, a decrease of 6% in 20 years.
Note: due to measuring my score, apart from an helpful comment, please to give a possible detailed feedback and to score for different part, thank you.

2D014E7FA6564F7B8.jpg
