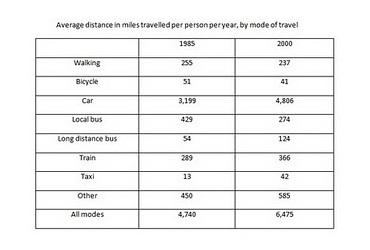
TOPIC: - The Table below gives information about changes in modes of travel in England between 1985 and 2000. Summarize the information by selecting and reporting the main features, and make comparison where relevant. -
TASK
The tables shows how modes of travelling changed in England in 1985 and 2000.
The most significant feature is that car remained the main mode of travel after 15 years. The average distance travvelled by car had the most impressive increasing, about 1400 miles per year while individual mode of travel, such as bicycle and walking had a slighly decreasing.
In the other handm colletiv mode, like train and bus, suffered a gently growing i the 15 year-period.
The second trand is that English people are travelling almost 2000 miles more per year in 2000 and they are travelling to longer distances as it can be seen by the 50% increase on long distance bus and the 50% dropping on local bus.
overall, the mais mode in bith years is the car and then the train.
Hi guys, Could you help me please? Any suggestion and correction would be appreciated.
Thank you so much... =)

TABLE
