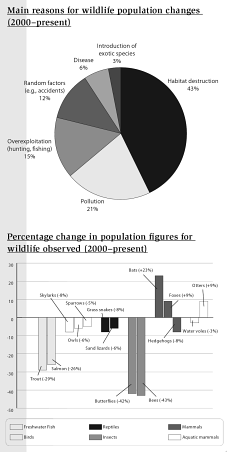
A comparison of percentage of main reasons for wildlife population changes and change in population figures for wildlife observed between 2000 and present day, a 15-year period is illustrated in the pie and bar chart. Overall, there have been proportions in the chart projections. In any case, while Habitat destruction has been a main factor for the changes, it has brought a significant impact to insects.
The pie chart had some different proportion. While the predominant reason for the population changes has been seen by Habitat destruction, Introduction of exotic species has only given little impact. What is more, 21% of wildlife population changes have been caused by pollution. Furthermore, even though disease had twofold percentage as much as the lowest figure for the main sectors, the proportions of random factors such as accidents and over exploitation like hunting and fishing have witnessed moderate differences at 12 percent and 15 percent respectively.
Interestingly, the bar chart has experienced a crowded data. From 2000-2015, although the figure for insects has increased 23% for bats, foxes' percentage has just been 9%. In contrast, the extinction of reptiles' population has risen more than two-fifths for both butterflies and bees. Then, freshwater fish has been the second endangered animals in the question period at -29% (trout) and -26% (salmon). Next, other categories have altered between -10 percent and 10 percent.

wildlife_population..png
