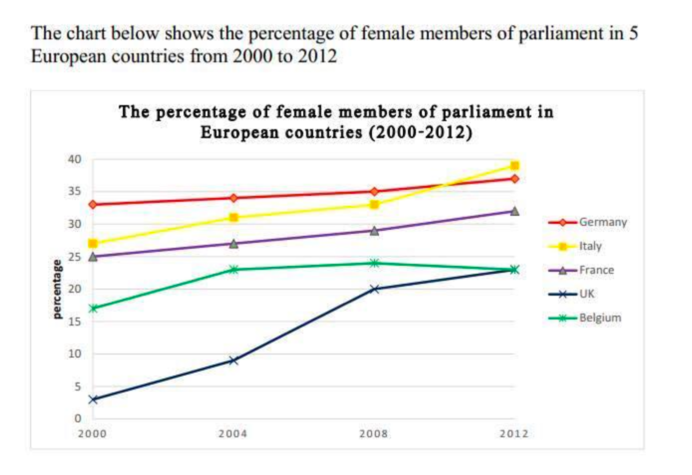
The line graph describes some European countries ratio of female members. Overall, the general trend was upwards, and the most popular members was Italy.
In 2000, the most popular ratio of female members of parliament was Germany, and the proportion of France was not as large as in Italy. Meanwhile, Belgium took up three times more female members than UK. In other hand, the percentage of Belgium and UK were a dramatic increase between 2000 and 2004, while the ratio of France, Italy, and Germany grew slightly to approximately 26 and 34.
The percentage of France, UK, Germany and Italy were a gradual climb, but the figure for woman attendees of assembly in Belgium made up a minimal decline between 2008 and 2012. Furthermore, the highest ratio of woman associates of parliament was Italy, while the lowest percentage was Belgium and UK in 2012. However, the proportion of woman participant of council in Italy was not as high as Germany.

Picture122.png
