IELTS Task 1 Pie Chart and Table
Task1:
The chart below shows what Anthropology graduates from one university did after finishing their undergraduate degree course. The table shows the salaries of the anthropologists in work after five years.
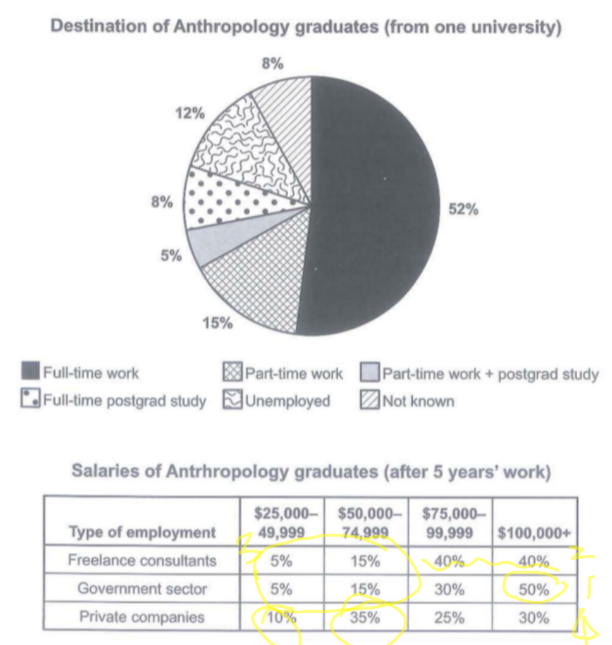
The pie chart shows what destination of anthropology graduates from one university took after graduating from their degree courses, the table compares the salaries the anthropologists received after five-years work in three different types of employment: freelance consultants, government sector and privates companies .
Overall, the majority Anthropology students chose to work after graduation, and the anthropologists who worked in government sector relatively earned higher incomes than other types of employment.
In the pie chart, over half of graduated anthropology students worked full time, accounting for the most significant percentage, while only 5% of them continued to study postgraduate degree and working part-time at the same time. The percentage of part-time workers, which was similar with unemployed's counterpart, occupied the second significant at 15%, compared with just 8% in both factors of full-time postgrad-study and not-known.
As shown in table, most of anthropologists in government sector earned over 100,000 dollar, at 50%, while the least at 20% in salaries between $25,000 and $74,999. Meanwhile, the freelance consultants were overwhelmingly employed in the upper pay scales at 40% in both $75,000 - $99,999 and $100,000+, the remainders were same as the government sector. However, in private companies, only 30% of employees payed over $100,000, and over half of them received lower payment under $74,999.

19140717mr7w.png
