Please help me to edit my essay below. I really appreciate your help.
Title: You should spend about 20 minutes on this task
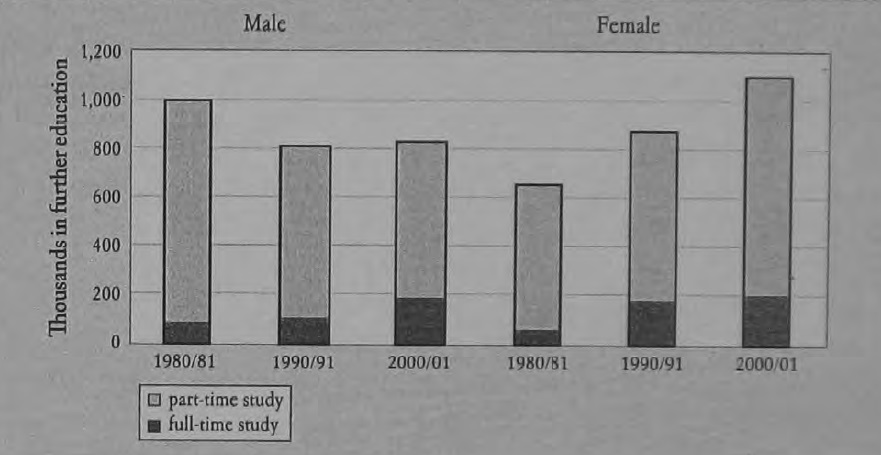
The chart below shows the number of men and women in further education in Britain in three periods and whether they are studying full time or part time. Sumarise the information by selecting and reporting the main features and make comparison where relevant.
The chart shows the changes in number of British male and female students in further education, both part-time and full-time during three periods
In part-time study, the number of men decreased slightly from 1 million in 1980/81 to over 800 thousands in 2000/01. On the contrary, the number of women engaging increased steadily from around 650 thousands to 1.1 million.
Meanwhile, the trend of students enrolling in full-time education in both genders was obviously upward. In 1980, there were only below 100 thousands men studied full-time. This number rose gradually to below 200 thousands in 2000/01. Similarly, only about 50 thousands women participated in full-time courses in 1980 but this number increased dramatically to below 200 in 1990 and by 2000, the number of male and female student became equal.
In conclusion, the data clearly shows that women gained more and more equality to men in term of further education during the periods in question.
changes in number of British students in further education
Title: You should spend about 20 minutes on this task
The chart below shows the number of men and women in further education in Britain in three periods and whether they are studying full time or part time. Sumarise the information by selecting and reporting the main features and make comparison where relevant.
The chart shows the changes in number of British male and female students in further education, both part-time and full-time during three periods
In part-time study, the number of men decreased slightly from 1 million in 1980/81 to over 800 thousands in 2000/01. On the contrary, the number of women engaging increased steadily from around 650 thousands to 1.1 million.
Meanwhile, the trend of students enrolling in full-time education in both genders was obviously upward. In 1980, there were only below 100 thousands men studied full-time. This number rose gradually to below 200 thousands in 2000/01. Similarly, only about 50 thousands women participated in full-time courses in 1980 but this number increased dramatically to below 200 in 1990 and by 2000, the number of male and female student became equal.
In conclusion, the data clearly shows that women gained more and more equality to men in term of further education during the periods in question.

Screenshot3.jpg
