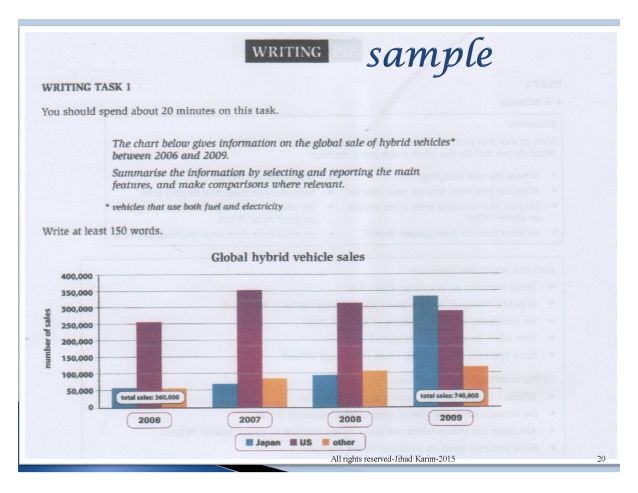
IELTS TASK 1 - BAR CHARTS INFORMATION ON THE GLOBAL SALE HYBRID VEHICLES BETWEEN 2006 AND 2009.
The chart compares the three countries in term of the sale volume of hybrid vehicles around the world in four years, from 2006 to 2009.
Overall, it is clear that the proportion of sales for each of the three countries changed. While the figure for the US was far higher than in the other countries over the period, the figure for Japan hit the highest position in the last year.
In 2006, the US sold vehicles five times more than the other, the number of sales was 2,50,000, it then rose to 3,50,000 which is highest sales for the period. For flowing years it remained higher than the rest of two except in 2009, at which it saw a fall to well below 3,00,000.
However, the figures for Japan and other were almost same at the beginning of period. Both the number continued to increase for the next two years from 50.000, but the growth of Japan was little bit less compared to other until 2008. After that the abrupt rise was in the proportion of sale of Japan from 200,000 in 2008 to just below 3, 50,000 in 2009, while other had experience a trivial increase.

268326_1_o.jpg
