Topic:
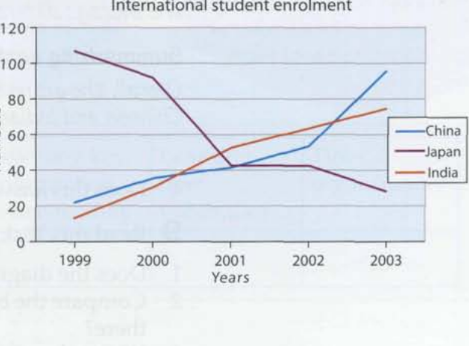
The graph illustrates the number of Chinese, Japanese and Indian students who enrolled at North Dean University over a five-year period.
The chart compares the proportion of students who come from China, Japan and India enrolled at North Dean University from 1999 to 2003.
Overall, there was an increase in the number of Chinese and India students, while a dramatic decline was seen in the Japanese student enrollment numbers.
At the start of the period, Japan had the most number of students, with over 100 students, while the figures for Chinese and Indian students was much lower, at around 20 students. The amount of Japanese student enrollment numbers started at 110, after which it experienced a sharp drop to 40 in 2001, before ending the period at 30. Opposite changes can be seen in the figures for Chinese and Indian student numbers. About 18 Indian students enrolled the university in 1999, with subsequent increase to 80 in the final year. Similarly, the figures for Chinese student enrollments had risen to 50 in 2002, before reaching a peak of about 95 in the end of the period.
The graph illustrates the number of Chinese, Japanese and Indian students who enrolled at North Dean University over a five-year period.
Summarize the information by selecting and reporting the main features, and make comparisons where relevant.
The chart compares the proportion of students who come from China, Japan and India enrolled at North Dean University from 1999 to 2003.
Overall, there was an increase in the number of Chinese and India students, while a dramatic decline was seen in the Japanese student enrollment numbers.
At the start of the period, Japan had the most number of students, with over 100 students, while the figures for Chinese and Indian students was much lower, at around 20 students. The amount of Japanese student enrollment numbers started at 110, after which it experienced a sharp drop to 40 in 2001, before ending the period at 30. Opposite changes can be seen in the figures for Chinese and Indian student numbers. About 18 Indian students enrolled the university in 1999, with subsequent increase to 80 in the final year. Similarly, the figures for Chinese student enrollments had risen to 50 in 2002, before reaching a peak of about 95 in the end of the period.

ahihi.png
