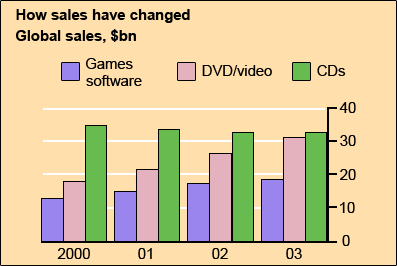
The chart below gives information about global sales of games software, CDs and DVD or video. Write a report for a university lecturer describing the information.
Answer:
The given bar chart shows the number of global products: games software, DVD/Video and CDs sold during a particular period of time, from 2000 to 2003.
According to the chart, the sales of games software rose gradually during the three years. Meanwhile, in the case of the DVD/Video, this figure had more double sales than that of games software. However, there was a slight decrease of sold CDs from 2000 onwards.
A more detailed look at the data presents, from 2000 to 2001 the sales of games software increased slightly with approximately 12-to-14 billion dollars, continued to nearly 20 billion dollars in the end of the year. By comparison with the sold DVD/video peaking at 30 billion dollars in 2003, this product had a low of the sales.
Looking backward 2003-2000, the global products of DVD/video started point in 20 billion dollars of the total sales, then it had been significantly better during the following years, with approximately 21-and-27 billion dollars. On the other hand, after a short peak of the sold CDs, with 34 billion dollars, this global product was a gradual slight drop in 2001 and 2002, then continued to a low of only 31 billion dollars in the end of the period.
Clearly, the numbers of global sales for games software and DVD/video rose steadily, while the sales of CDs showed the reverse.

g2.png
