Unanswered [0]
  

Home / Writing Feedback   % width   Posts: 2


IELTS Writing Task 1: The chart illustrates the income of households in the US


Dennis Dawl 1 / -  
Sep 8, 2023   #1

annual earnings of American households


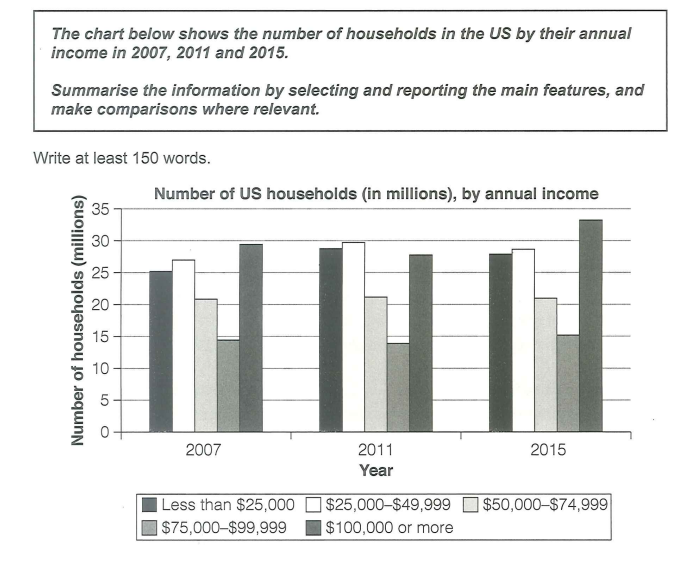
The bar chart illustrates changes in the annual earnings of American households in three separate years 2007, 2011 and 2015.

Overall, the yearly income for household in the US increased slightly from 2007 to 2015. There was a significant difference between the number of people with income ranging from 75,000 to 90,000 dollars.

The number of households, who were paid less than 50,000 dollars per year, rose considerably to approximately 58 million people from 2007 to 2011. However, the figure fell slightly in 2015, by 5 million, but still higher than 2007. People with more than 100,000 dollars earnings per year took the highest number in 2007, with nearly 30 million. Although there was a moderately decrease in 2011, the figure for households making more than 100,000 annually reached a peak of 33 million in 2015.

It is clearly that the number of people in 4 other ranges of earnings overtook that of the income ranging from 75,000 to 99,999 dollars. The number was significantly low in three years, at 15 million. The figure for people in the remaining range experienced a leveling out, at 21 million.

  • Capture.PNG


Holt  Educational Consultant - / 15466  
Sep 24, 2023   #2
The last paragraph of this essay is not structured as a mere report, which affected the overall presentation of the analysis. The task 1 essay requires only a single trending statement or paragraph. You added a secondary trend towards the ending. Rather than placing that information at the very last part, you should have integrated that into the actual trending presentation instead. It is alright to present a full trending paragraph to the reader if you feel that there is more than one trend in the image. You just have to structure the overall paragraph format correctly to achieve your desired purpose. Otherwise, the additional information can confuse your presentation clarity, lowering your score in the process.


Home / Writing Feedback / IELTS Writing Task 1: The chart illustrates the income of households in the US
ⓘ Need Writing or Editing Help?
Fill out one of these forms for professional help:

Best Writing Service:
CustomPapers form ◳

Graduate Writing / Editing:
GraduateWriter form ◳

Excellence in Editing:
Rose Editing ◳

AI-Paper Rewriting:
Robot Rewrite ◳