Unanswered [1] | Urgent [0]
  

Home / Writing Feedback   % width   Posts: 4


In the chart the percentage of people using multiple social networking sites; Ielts 2


baohii2001 1 / -  
Dec 9, 2019   #1

social networking sites popularity trends


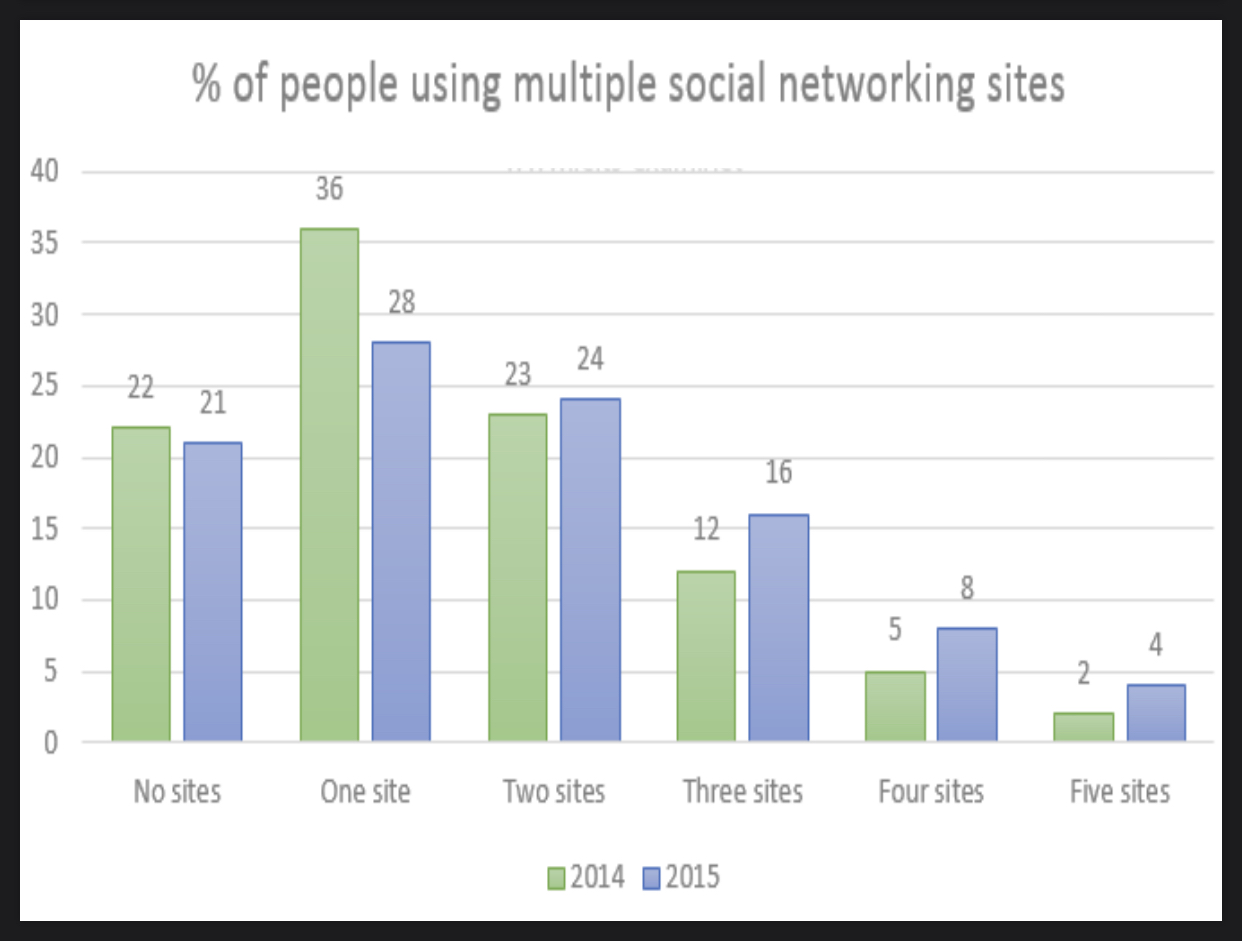
The bar chart illustrates the number of social networking sites people used in Canada in 2015 and 2014. Overall, in 2015, people tend to use more than one social networking site than in 2014

It's noticeable that the percentages of people using one site are the highest in both 2014 and 2015, with 36% in 2014 and 28% in 2015. However, during one year, the number of people who used one site and no sites has declined, especially there is a sharply decrease in the group which people are reported using one social network. For more details, from 22% to 21% in 2014, from 36% to 28% in 2015.

In contrast, there are upward trends in the number of Canadian users connected to more than only one site. For example, in 2014, the percentages of three sites social networking users is 12% and after one year, it has increased to 16%. Similarly, the proportion of four sites Canadian visitors has risen 3% for 1 years, from 5% in 2014 to 8% in 2015.

  • 645E6E1AA8ED4D6EB.jpeg


hungxd08 3 / 5  
Dec 10, 2019   #2
Hi,
I have some comments on your essay as follow:
1. "..." should be change to " a sharply decrease";
2. In my opinion, when I take a glance at your second paragraph, it quite hard to recognize the link between the second sentence and the third one. The third one make me quite confused. I think they should be made clearer.

3. You might not mention directly "Group Five". It might be mentioned as Group five accounts for the lowest proportion compared to others or something like that.

I hope they might be beneficial for you!
Best regards,
Hung
santrinabawi 2 / 2  
Dec 12, 2019   #3
Let me give some correction for you:

1. You did not upload question image completely, so we as reader do not know there is country Canada in question.

2. You did not write period punctuation (.) in the end of your overview.
WaddahHamzah 1 / 2  
Dec 13, 2019   #4
Hello there..

Let me give you some comments:

Firstly, it is about your introduction. I found you did not paraphrase the question. It will be better if you write:

The bar chart illustrates the percentage use of multiple social networking sites in ...

or

The bar chart illustrates the percentage of people using multiple social networking sites in ...

you can also change it into passive sentence. For example:

The percentage use of multiple social networking sites by Canadian in two different years, 2014 and 2015, is illustrated in the chart.

As it can be seen, it is specifically discuss about the percentage of the use or the people, either for those who do not have any social networking accounts, or use one or even more.

Next, When it comes to the overall, you only put one trend which for me, it is too specific. Try to write the general trend while including the language of comparison and changes to your overall. If I were you, I will write at least two sentences.

Let me give you an example:

Overall, majority people in Canada tend to use one social media site compared to the other preferences, and this significantly contrasted to the percentage of people with 5 social sites, which was the lowest one. Also, the figure of users with more than one online social platforms experienced a slight increase in the following year.

Hopefully. those might be beneficial for you.

Best Regard,

WaddahHamzah


Home / Writing Feedback / In the chart the percentage of people using multiple social networking sites; Ielts 2
Do You Need
Academic Writing
or Editing Help?
Need professional help with your assignments? Fill out one of these forms:

Graduate Writing / Editing:
GraduateWriter form ◳

Best Essay Service:
CustomPapers form ◳

Excellence in Editing:
Rose Editing ◳

AI-Paper Rewriting:
Robot Rewrite ◳