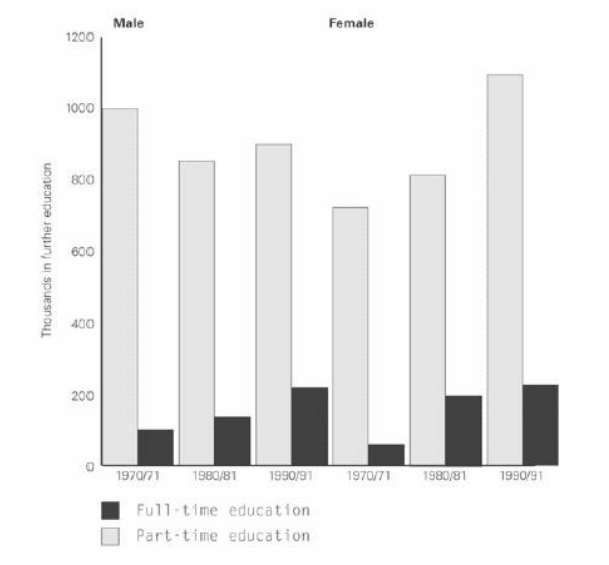
The chart below shows the number of men and women in further education in Britain in three periods and whether they were studying fulltime or part-time.
The bar chart provided indicates the figure for males and females in more education in Britain in three periods and their studying modes.
As the gender was concerned, the males with further education were around 1000 thousand (K) in 1970/71 and 800K in 1980/80 respectively, while the females with that were only approximately 750K in 1970/71 and 800K in 1980/81. There was a wide gap between males and females in these two periods. Following that it is remarkable that those women having further education rebounded by 300K, at 1100K, which was overwhelmingly higher than that of men (850K).
Moreover, it is also noticeable that the people studying part-time education were much more than those studying full-time education. Those who studied part-time education were more or equal to 1000K in both genders in 1980/91, whereas those who studied full-time education were fewer or equal to 200K.
Overall, it illustrates the continuous needs of further education from 1970/71 to 1990/91. The people accepting part-time education is higher than full-time education a lot, although there were the stable rises in those accepting full-time education from 1970/71 to 1990/91.
This is my second time to do ielts writing task 1, plz rate my writing and give some suggestions to me. THX!!!!!!!!!!!!!!!!!!!!!!!!!!

123123.png
