the amount of unfit persons in australia
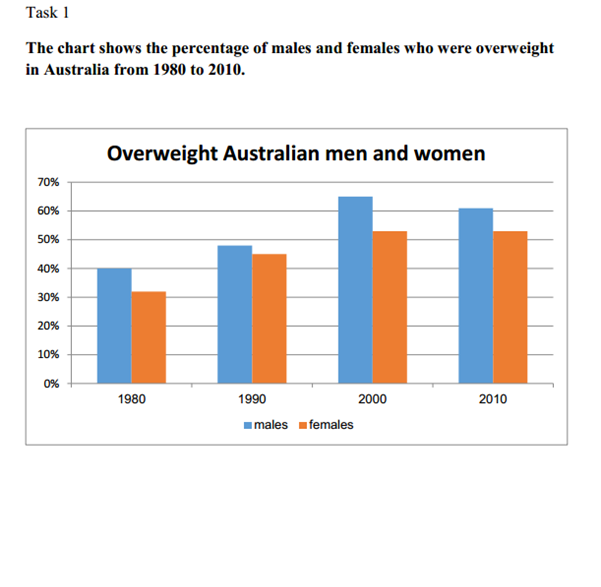
The diagram illustrates the proportion of people who excess weight for both genders in detail between 1980 and 2010 in Australia. Overally, it shows that the proportion of men who are overweight has been more than women in the 10 years. Moreover, it is recognizable that the number of female with the same attitude has been raising while males had a drop between 2000 and 2010.
The proportion of overweighed men started with 40 percent and reached to near 50 percent in 1990 and eventually make it to 65 percent in 2000.After this excess time, this proportion number went down to 60 percent in 2010. In comparison, the proportion of over weighted women has been always growing about 15 percent every 10 years from 1980 to 2000 and after that had a steady record for 10 years. As it can be seen, female unfit proportion number started with 30 percent in 1980 and reached to 55 percent in 2010.
In conclusion, it can be resulted that the amount of unfit women has moderately enlarged while men's record reveals a growth between 1980 to 2000 and a reducing trend in the next 10 years.

326028_1_o.png
