Summarize information from the charts
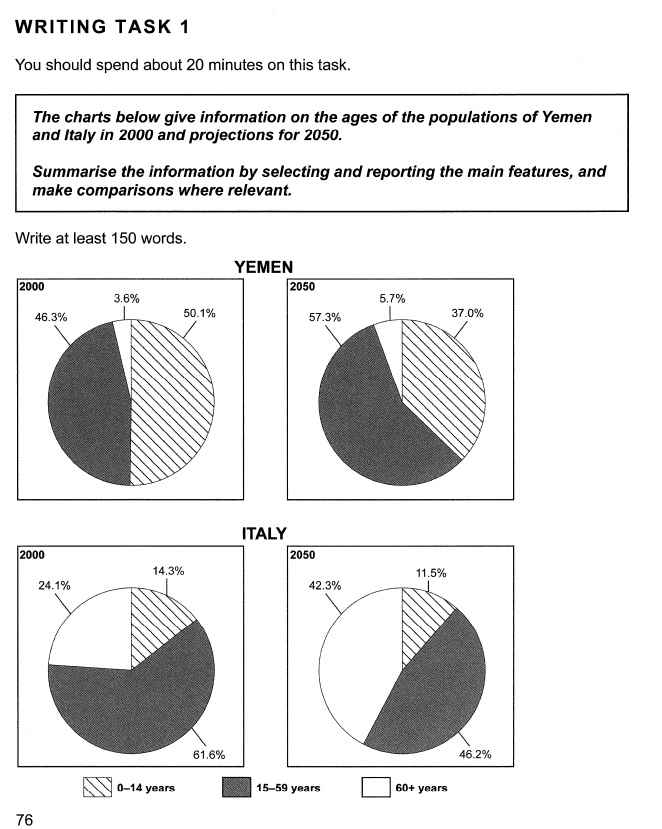
The pie charts indicate the percentage among age groups of the residents of Yemen and Italy in 2000 and the estimate of both countries for 2050.
Overall it is clear that they divide ages into three groups include people under 14 years, 15 to 59 years and more than 60 years. The group of 15 to 59 years mostly account for a relatively large number of populations.
Looking at the pie charts in 2000 closely, one can see that the majority of population in Yemen was under 14 years with 50.1%, next to it was the group between 15 and 59 years has 46.3%. While most of the population in Italy was from 15 to 59 years with 61.6%, next to it was over 60 years with 24.1%. By contrast, the smallest proportion of population in Yemen was people over 60 years only 3.6%, whereas people under 14 years accounts for the least percentage in Italy with 14.3%.
According to the projections for 2050, it is clear that an upward trend is seen in the group between 15 and 59 years in Yemen, which will get the highest percentage from 46.3% to 57.3%. On the other hand, the group under 14 years will decrease to 37.0%, finally the group over 60 years will be the smallest population in Yemen with 5.7%. However, after 50 years, Italy still keep the majority of population, which will be the group between 15 and 59 years with 46.2%. In addition, people who over 60 years will rise heavily from 24.1% to 42.3% and next to it will be under 14 years, decrease moderately to 11.5%

Informationopopula.jpg
