marriages and divorces statistics
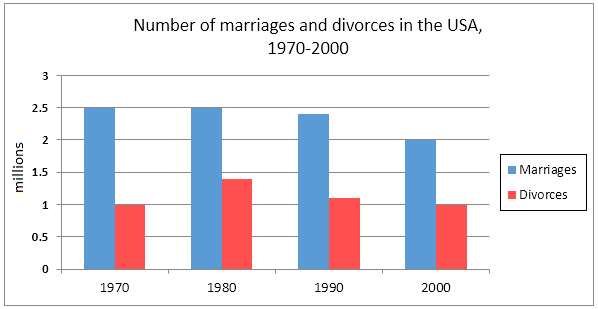
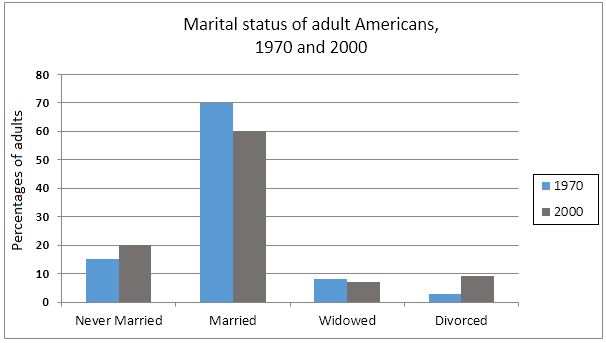
The figure depicts information about the weeding ceremony and splitsville ratio of USA from 1970 to 2000,whulile bachelorhood of men and women Americans in teo annual
Ia an overview, it can be notice that marriages ration is twice than divorce throughout the period whereas, in second table, married proportion of adults is highest as compared to other marital status in both years
As can be seen from the figure that in 1970 an 1980,2.5 million were marriage which is Highest rate. Similarly, in 1980 approximately 1.4 millions were divorced which is the highest rate. In 990 number of maarigae and divorced had slightly decreased by about 2. 3 million and 1.2 million respectively from 2.5 millinlon and 1.4 million of 1990
In addition, as per second table, highest proportion of adults were in married In 1970 and 2000 by 70 as well as about 60 percentage whereas least proportion were divorced, in1970 and widowed, in 2000

Number of marriage and divorced in the USA 1970 - 2000ll

Marital status of adults American, 1970 and 2000

