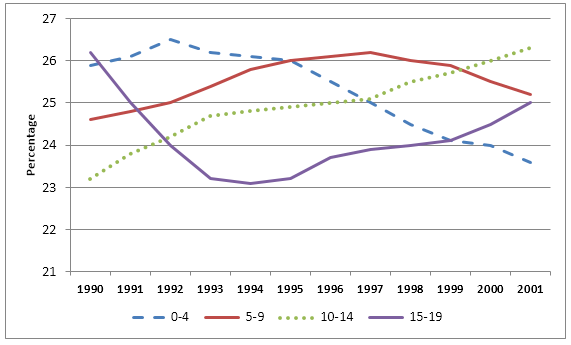
The graph shows children by age group as a percentage of the young population in the United Kingdom between 1990 and 2001.
Summarise the information by selecting and reporting the main features, and make comparisons where relevant.
The provided line chart gives information on how many children in the UK's juvenile populace according to their age group over the course of 11 years starting from 1990.
Overall, it is clear that the ratio of teenagers from 10-14 surged dramatically over the period, while the youngest age group's percentage witnessed a modest downward trend.
To begin with, the proportion of the 0-4 years infants, after an oscillation, stabilized at 26% between 1993 and 1995. However, it plummeted moderately to approximately 23,6% in 2001. For the 5- 9 years children, their percentage climbed gradually from 24,6% to 26,1% during the first 7 years, before decreasing slowly to 25,1% in 2001.
From 1990 to 1993, the rate of 10-14 years teenagers jumped modestly to 24,8%, while that of 15-19 years juveniles declined rapidly to 23,1%. Nevertheless, during the last years of the period, populations leaped dramatically in both the 10-14 and 15-19 age groups, the former by 1,4% and the latter by 1,9%.

ieltsgraph308chil.png
