Writing task 3 : Comparison Energy of Production
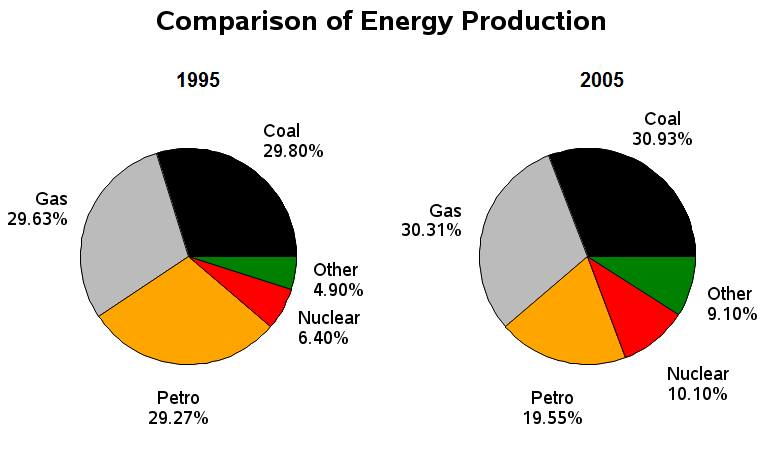
The pie charts compare the percentage of France's energy production in 5 categories in 1995 and 2005. Overall, it can be clearly seen that the highest production of energy was coal, while other had the smallest proportion in both years.
The coal was the most popular energy in France, it successfully broke a record as the greatest proportion by 1995 (29,80 %) and 2005 (30,93%). The production of petro in 1995 was higher than in 2005 at 29,27 % and 19,55 % respectively, when it was also recorded as the biggest difference of proportion. On the other hand, there was a slight increase of gas production in first and second period, when it produced 29,63 and 30,31 percent successively.
The nuclear and other became uncommon energy which was produced in both years. The nuclear energy produced in 1995 was 6,4 % and increased to 10,1 % in 2005. While the production of other was 4, 9 percent and grew even bigger to 9,1 percent in 2005.

Comparison_of_energy.jpg
