Hi, I'm about to take the IELTS exam next moth, so I'm here to ask for helps
Could you please have a quick glance at my writing task 1 essay (bar chart expository essay)? I'm so grateful for your contribution. I'm also enclosing a photo, the dissolution is, however, quite low because of the website's regulations of limited photos' size. Thanks in advance
Here is my work!
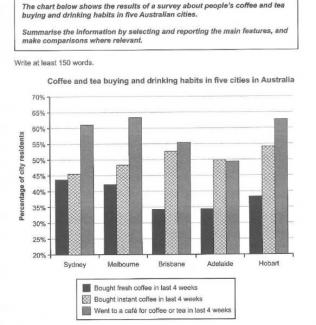
The diagram indicates how the habit of purchasing and consuming two types of beverage (coffee and tea) varies in five Australian metropolises in the past four-week period.
From an overall perspective, it is undoubted that the number of Australians going for a drink at local cafés accounts for the largest percentage in total throughout the investigated cities, while fresh takeaway coffee is the least favorite option. In addition, the gap between instant and fresh coffee choices in Brisbane and Adelaide is less remarkable than that of Sydney, Melbourne and Hobart.
To begin with Sydney and Melbourne, more than 60% of Australians living in those cities prefer drinking coffee and tea at cafés. Approximately 45% of people in Sydney are used to buying instant coffee, which is about 5% less than those in Melbourne. The number of citizens who decide to purchase fresh coffee in two towns stand at around 43%.
Regarding the remaining towns, 50% to 53% of Australian residents choose to purchase instantly made coffee, which is around 15% greater than the percentage of those who favor fresh coffee. Moreover, the habit of going for coffee and tea in Hobart constitutes the highest proportion compared the rest of cities, which is 10% and 15% larger than the two cities, Brisbane and Hobart respectively.
(214 words)
Have a good day!
Could you please have a quick glance at my writing task 1 essay (bar chart expository essay)? I'm so grateful for your contribution. I'm also enclosing a photo, the dissolution is, however, quite low because of the website's regulations of limited photos' size. Thanks in advance
Here is my work!
bar chart expository essay
The diagram indicates how the habit of purchasing and consuming two types of beverage (coffee and tea) varies in five Australian metropolises in the past four-week period.
From an overall perspective, it is undoubted that the number of Australians going for a drink at local cafés accounts for the largest percentage in total throughout the investigated cities, while fresh takeaway coffee is the least favorite option. In addition, the gap between instant and fresh coffee choices in Brisbane and Adelaide is less remarkable than that of Sydney, Melbourne and Hobart.
To begin with Sydney and Melbourne, more than 60% of Australians living in those cities prefer drinking coffee and tea at cafés. Approximately 45% of people in Sydney are used to buying instant coffee, which is about 5% less than those in Melbourne. The number of citizens who decide to purchase fresh coffee in two towns stand at around 43%.
Regarding the remaining towns, 50% to 53% of Australian residents choose to purchase instantly made coffee, which is around 15% greater than the percentage of those who favor fresh coffee. Moreover, the habit of going for coffee and tea in Hobart constitutes the highest proportion compared the rest of cities, which is 10% and 15% larger than the two cities, Brisbane and Hobart respectively.
(214 words)
Have a good day!

barchart_3.jpg
