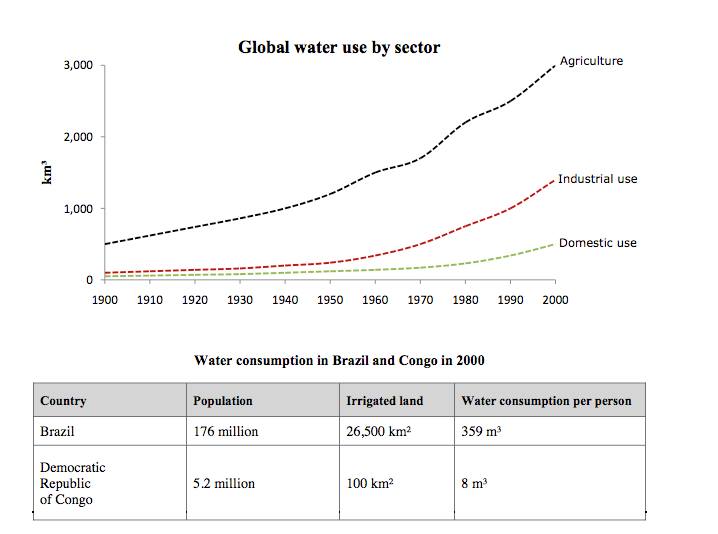
The line charts show Ratio global water use by sector domestic use, industry use and agriculture between 1900 and 2000 while the table give information about water consumption in brazil and congo in 2000. Overall line charts show most poeple were use agriculture sector and the least was domestic use, on the other hand the table illustrates ratio water user in brazil much more than congo.
According the information line chart, we can see utillization agriculture sector increase steadly at 3,000 cubic, it was seem highly part in the global water, and the domestic use rise gradually at two thousand, althought it was describe slights more than industrial use and agriculture. While the table present information the big population followed by water utillizer. Comparasion irigated land brazil twenty sixth times more bigghest than congo. Comparing both table and line charts, in 2000 there were fascinating phenomena, irigated land brazil and global water both of them increase, on the other hand water consumption in brazil much more than domestic use in global water.
According the information line chart, we can see utillization agriculture sector increase steadly at 3,000 cubic, it was seem highly part in the global water, and the domestic use rise gradually at two thousand, althought it was describe slights more than industrial use and agriculture. While the table present information the big population followed by water utillizer. Comparasion irigated land brazil twenty sixth times more bigghest than congo. Comparing both table and line charts, in 2000 there were fascinating phenomena, irigated land brazil and global water both of them increase, on the other hand water consumption in brazil much more than domestic use in global water.

BLEND_CHART.jpg
