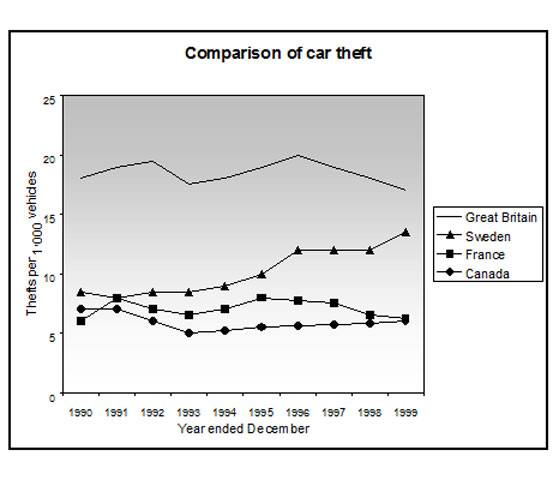
The graph presents the information about car robbery in one decade started in 1990. Overall, it seems clearly that Great Britain and France, in the last year on 1999, had a gradual decline than several years before.However, the rates of Sweden and Canada steadily rose in the years before the calculation ended.
Great Britain possessed two peak points in the 1992 and 1996 to almost 20,000 vehicles for both peak points and then it ended with incline trend from 1996 to 1999. Nearly in the same way, France held a wavy movement in which the number of car robbed intersected with Sweden in the 1991 then finally the last year was close in 7,000 cars.
The next illustration, cars robbed in Sweden always increased from the first year from more or less 9000 vehicles into the three times constant during 1996 to 1998 and stayed in 14,000 at last. In addition, Canada firstly plummeted in 1991 and had the lowermost point at 5,000. In brief, this country's proportion met the same point as France in the closing position in 1991.

14390879_10205915840.jpg
