ielts writing task 1 - three pie charts show the changes in annual spending by a particular UK school
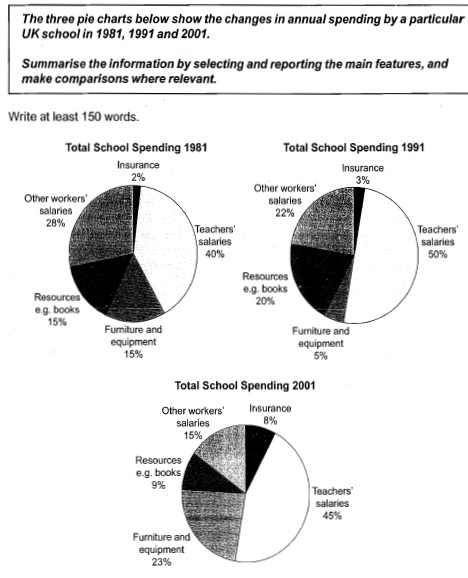
A comparison of different areas where some schools in UK spent their yearly budget from 1981 to 2001, a 2-decade period is presented in the pie charts. The data is measured in percentage. Overall, most of the school budget were spend to pay the teacher's salary in each year. In any case, majority of the areas experienced a fluctuation during the period, while insurance area saw an upward trend.
By 2001, school in UK spent their budget mostly to pay the teachers, more than two fifths from the percentage, increased from only 40% in 1981. Yet, the figure fell slightly decreased by 5% from 1991. In addition, spending in furniture and equipment was the second highest of proportion in 2001 with 23%, increased from only 5% in 1991 and 15% in 1981 respectively. Spent in the resources field also saw a fluctuation trend during the question period, with less than a fifth in the beginning and finish with only about 9% in the period.
Interestingly, school were reduced their spent to pay other workers, only recorded 15% in 2001, decreased gradually from about 22% in 1991 and almost less than a third in 1981. While, the figure for insurance increased slightly during the period, from only 2% in 1981 but then school in UK spent their 8% of budget to the insurance area in 2001.

ielts_1__6_test_3.j.jpg
