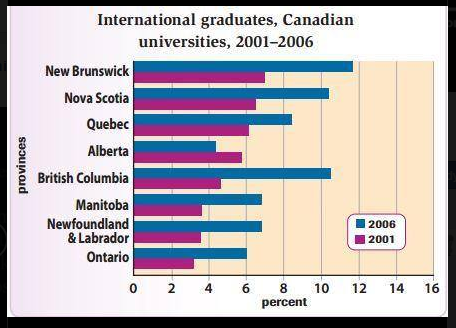
The bar chart presents the proportion of graduated international students from college in different Canadian provinces from 2001 to 2006. Overall, the majority of the student graduations from different locations experienced an increase over 5-year period. In any case, while all provinces showed a significant rise, only Alberta province decreased from 2001 to 2006.
According to the chart, there were three provinces witnessing the highest percentages of students who graduated from university in provinces of Canadian just above 10% from between 2001 and 2006. British Columbia was the highest difference of proportion approximately by 5% to 11% over 5-year period. Students who graduated from New Brunswick and Nova Scotia province were the second popular graduation that had a similar percentage, approximately by an increasing 2% from 2001 to 2006.
A closer look at the percentage of the data revealed that Manitoba, Newfoundland & Labrador and Ontario provinces had the same percentage as the increasing number of students who new graduation with regarding to 3% during a period of time. Interestingly, only Alberta province presented a decreased by approximately 1% over the time of period.

266935_1_o.png
