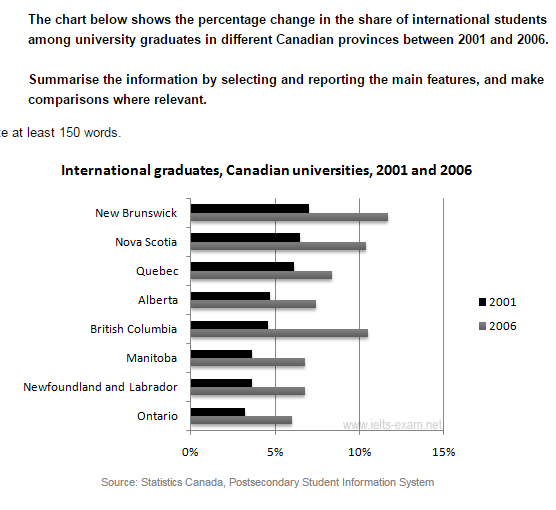
A comparison of the proportion change in the overseas students' number graduating from many third-level educations in 8 Canadian provinces from 2001 to 2006, a 5-year period is experienced in the bar chart. Overall, while 2006's figure for foreign students dominated in this question period, New Brunswick witnessed a higher percentage rather than other provinces.
Some provinces saw a significant change for international students. British Columbia witnessed the greatest change of foreign pupils from 4.5% in 2001 up to 10.5% in 2006. However, the lowest alteration was shown by Alberta with the gap one percent. Furthermore, while both figures in New Brunswick surpassed from all categories, which were the highest proportion, the lowest percentage in 2001 and 2006 was in Alberta and Ontario repetitively.
A more detailed look at the chart reveals that a slight decrease's figure and almost unchanged proportion revealed in many provinces. 6.5 percent to 10.5 percent was a dramatic increase for the percentage of international graduated pupils, whilst Quebec's figure was much lower than Nova Scotia from 5.2% to 8.5% between 2001 and 2006. In contrast, the student's figure for Manitoba and Newfoundland & Labrador flattened out at 3.5 percent in 2001 and 7 percent in 2006 for overseas students graduating from some universities.

Capture_1.PNG
