You should spend about 20 minutes on this task. Write at least 150 words.
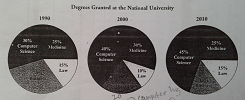
The charts below show degrees granted in different fields at the National University in the years 1990, 2000, and 2010.
Summarize the information by selecting and reporting the main features, and make comparisons where relevant.
The pie chart illustrates the information about the degrees granted at the National University in different majors in the years 1990, 2000, and 2010. At the first glance it is evident that computer science is higher than other majors over the period. Medicine and law experienced fluctuation, and Business is lower than other subjects in the end of period.
To begin, in 1990. The percentage of degrees granted for computer science was at less than a third, then increased significantly in 2000 at two-fifths, and the next ten years this major becomes most popular at more than two fifths at the end of period. However, the degrees granted of business saw significant fall at 30 per cent, 20 per cent, and 15 per cent respectively over the timeframe.
Moving to a more detailed analysis from the pie chart reveals that medicine and law had the same pattern of the degrees granted. In 1990, the degrees granted of medicine at a quarter, and the next ten years became less than a third, but the third period in 2010 slight fall at a quarter again. The degrees granted of law was the lower that other majors only at 15 % in 1990, then decreased significantly at 10 %, and the end of period was significant rise at 15 %.

TASK1_scoring3.PNG
