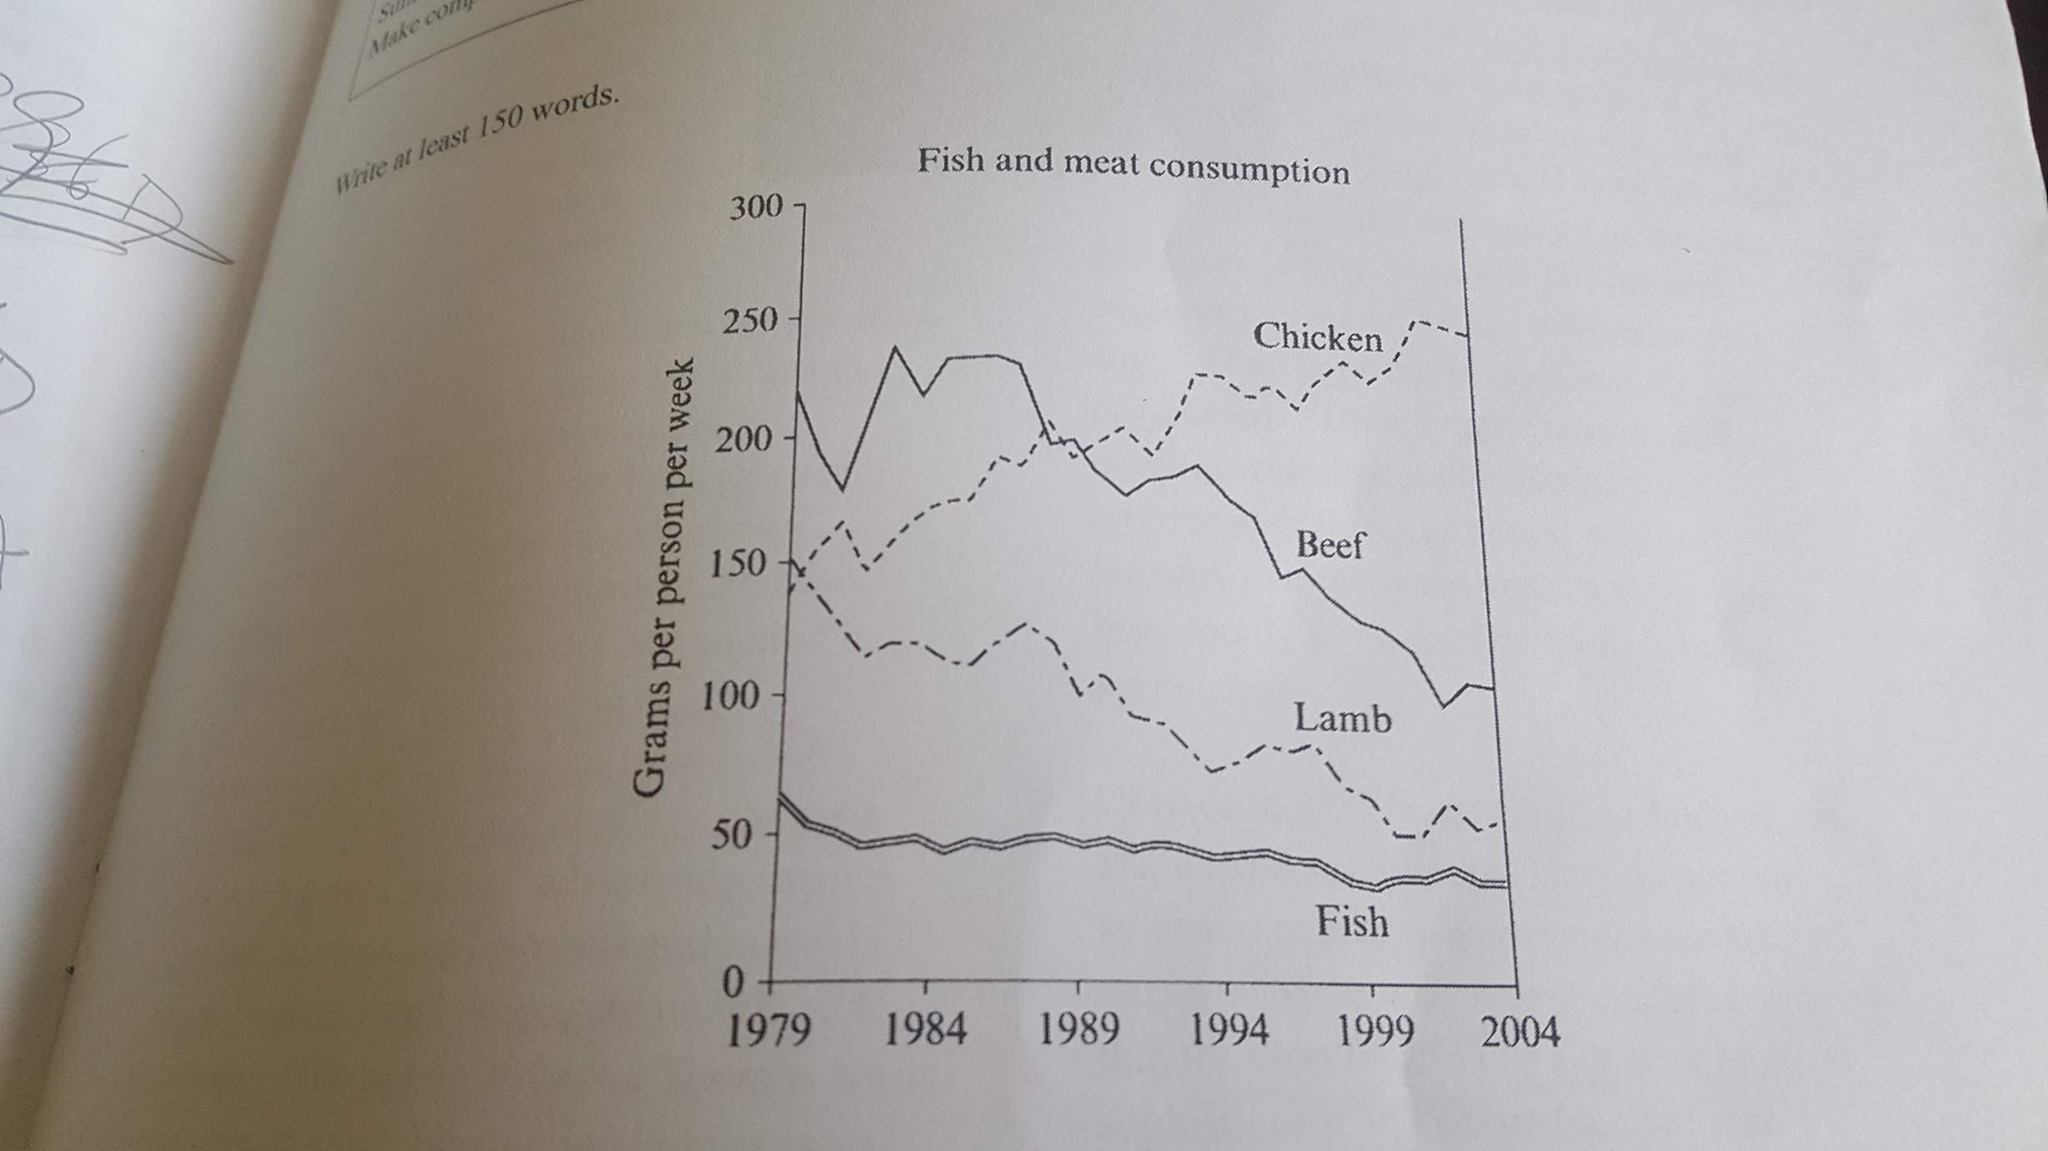
The graph below shows the consumption of fish and some different kinds of meat in a European country between 1979 and 2004.
Summarise the information by selecting and reporting tha main features, and make comparisons where relevant.
Write at least 150 words.
The diagram illustrates fish and meats consumed in a country in Europe during the period from 1979 to 2004.
In general, the consumption level dropped throughout the years between 1979 and 2004. Among all kinds of food, the amount of chicken ate was the only rising number while other three items' figures decreased.
In 1979, there were more than 200 grams of beef consumed per person per week which was the highest figure. The lamb consumption amounted to around 150 grams per person per week while the figure of chicken as food was just 10 grams lower than the lamb consumption. Last but not least, people ate about 60 grams fish per week.
The consumption of beef drastically plummeted to just over 100 grams per person per week in 2004 although this amount has once peaked at the level of almost 250 grams in a year from 1979 to 1984. The weights of lamb and fish consumed fell steadily to approximately 60 grams and below 50 grams respectively in 2004. In contrast, chicken was the only choice became more popular in the 25 years. Its consumption level skyrocketed to around 250 grams per person per week. (196 words)
Summarise the information by selecting and reporting tha main features, and make comparisons where relevant.
Write at least 150 words.
appetite for meat and seafood
The diagram illustrates fish and meats consumed in a country in Europe during the period from 1979 to 2004.
In general, the consumption level dropped throughout the years between 1979 and 2004. Among all kinds of food, the amount of chicken ate was the only rising number while other three items' figures decreased.
In 1979, there were more than 200 grams of beef consumed per person per week which was the highest figure. The lamb consumption amounted to around 150 grams per person per week while the figure of chicken as food was just 10 grams lower than the lamb consumption. Last but not least, people ate about 60 grams fish per week.
The consumption of beef drastically plummeted to just over 100 grams per person per week in 2004 although this amount has once peaked at the level of almost 250 grams in a year from 1979 to 1984. The weights of lamb and fish consumed fell steadily to approximately 60 grams and below 50 grams respectively in 2004. In contrast, chicken was the only choice became more popular in the 25 years. Its consumption level skyrocketed to around 250 grams per person per week. (196 words)

mock_7_test_2.jpg
