Unanswered [1]
  

Home / Writing Feedback   % width   Posts: 3


IELTS Task 1 Consumption and production of potatoes


RomanKoch 10 / 22  
May 5, 2020   #1

Potatoes' supply and demand


Task: The tables below provide information about the consumption and production of potatoes in five parts of the world in 2006.

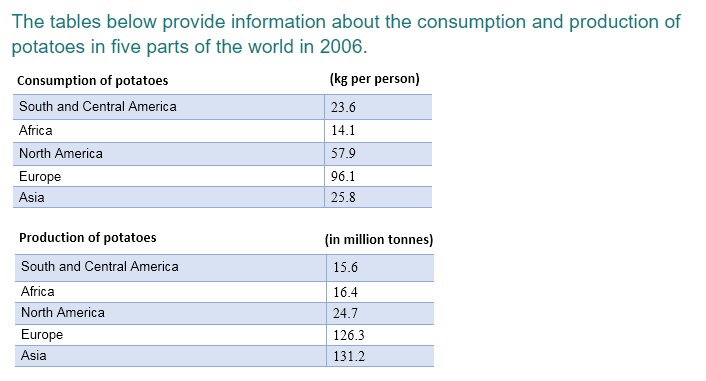
The two tables reveal how much potatoes people from five different regions ate and the production rates of this crop by the same regions in 2006. The former number is measured in kilograms per person and the latter in million tonnes. Overall, the highest consumption of potatoes was recorded in Europe and the lowest in Africa. In terms of production, the leading position was held by Asia, while South and Central America contributed the least to the potato market.

As the first table shows, a person from Europe, on average, ate around 96 kg of potatoes in 2006, followed by North Americans with slightly under 60 kg per person. Only a fraction of that, 14 kg per person, was consumed by Africans, whilst people in South and Central America and Asia showed similar eating preferences with around 25 kg for each region.

According to the second table, Asia and Europe were the world's leading potato suppliers accounting for 131.2 and 126.3 million tonnes respectively. The production figures for the other three countries were significantly lower, standing at 15.6 million in South and Central America, just over 16 million in Africa and around 25 million tonnes in North America.

  • test2.jpg


Holt  Educational Consultant - / 15461  
May 6, 2020   #2
There are 2 tables presented for your analysis. You should have indicated that separation in your summary overview. It should have been presented as:

2 tables containing 4 sets of inter-related information has been presented for analysis. Table 1 indicates the rate by which an average person consumes potatoes based on kilograms. Table 2, presents related information pertaining to the production of potatoes in the million of tonnes. Both charts based the information on a survey of 5 regions across the world. The regions canvassed were South and Central America...

The overview should always represent the factual information, in short form from all the provided image. You cannot do one image and omit the other. That will show a lack of proper and full analysis on your part, which will affect your overall TA score. The rest of the presentation is solid. You did a good job with your analysis. You clearly showed that you understood what the target audience of the report is and you proceeded to write the data report for that crowd. Good job.
lehoang1294 2 / 4  
May 6, 2020   #3
Great essay! I learned a lot from this one.
But in my humble opinion, I think you should divide your essay into 4 paragraphs: Opening - Overview - Body 1 - Body 2.
This kind of structure is way easier and clearer to present for your analysis, especially in Ielts writing task 1.


Home / Writing Feedback / IELTS Task 1 Consumption and production of potatoes
ⓘ Need Writing or Editing Help?
Fill out one of these forms for professional help:

Best Writing Service:
CustomPapers form ◳

Graduate Writing / Editing:
GraduateWriter form ◳

Excellence in Editing:
Rose Editing ◳

AI-Paper Rewriting:
Robot Rewrite ◳