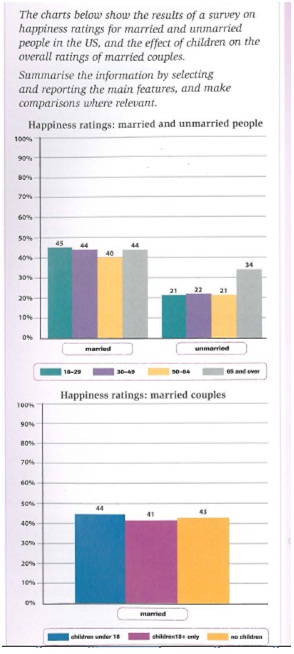
The first bar chart presents the correlation between happiness and marriage status in the US. Both married and unmarried are categorized into four age groups. Related to the second bar chart, it shows the level of happiness on married people based on the children they have.
Overall, the survey proves that the married people are twice happier than the other who are unmarried. Also, having children or not is not so influential on the happiness level of the married people. Married people who have no children also have the happiness ratings nearly the same as the other who have children under 18 years old and 18 above.
All age groups of married people have the percentage of happiness in a nearly same number around 40 - 45 percent, while unmarried people only have 21 - 34 percent. The happiest age of married people is the group at 18 - 29 years old while the unmarried group at 65 years old and over is the happiest than the other. Then, married group who have children under 18 years old is the happiest at 44 percent of the ratings.

happiness.jpg
happiness2.jpg
