BOOK CLUB GRAPH ANALYSIS
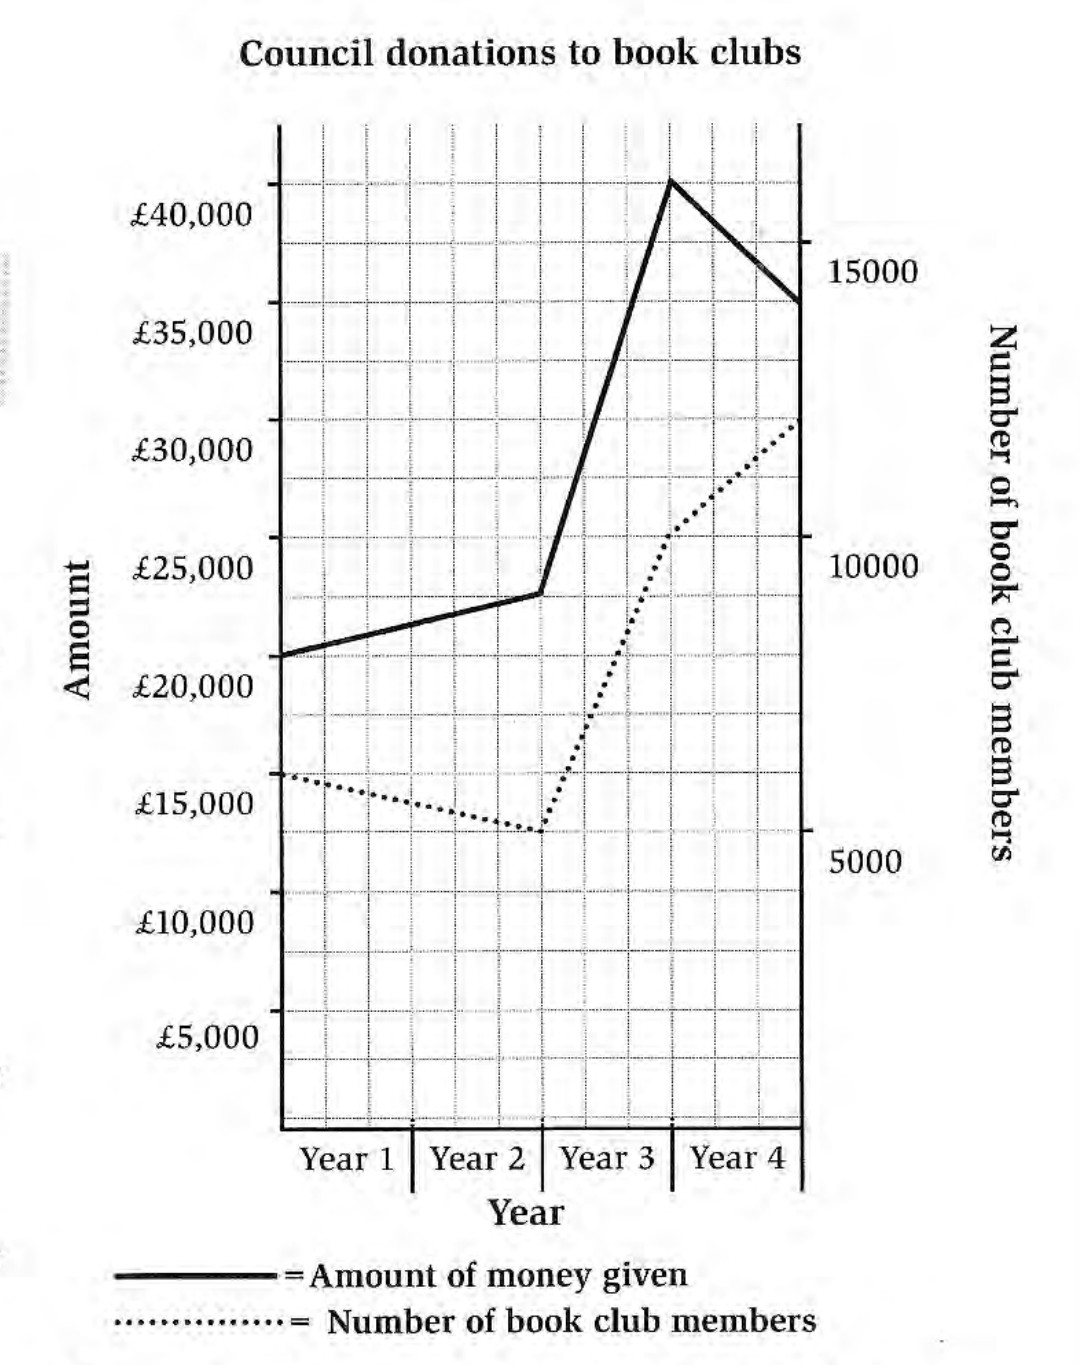
The graph shows how much money book clubs received from a city council and The number of club members over four years.
In year 1 ,there were 6,000 club members and the money The city council gives to Book clubs was 20,000
Between year 1 and year 2,there was a slight decrease in club members from 6,000 to 5,000
However,in the same periods The money The council gave to Book clubs increased slightly
In year 3,the club members rose sharply.there was also a dramatic increase in the amount of money The council spent in book clubs.It peaked that year at £40,000.In year 4,
The number of book club members continued to rise,Reaching a peak at 12,000 members,The Money The book clubs received from the Council
fell by £5,000.
Generally,there has been an upward trend in the number of book club members, even though less money was given to clubs in year 4

Screenshot_2022022.jpg
