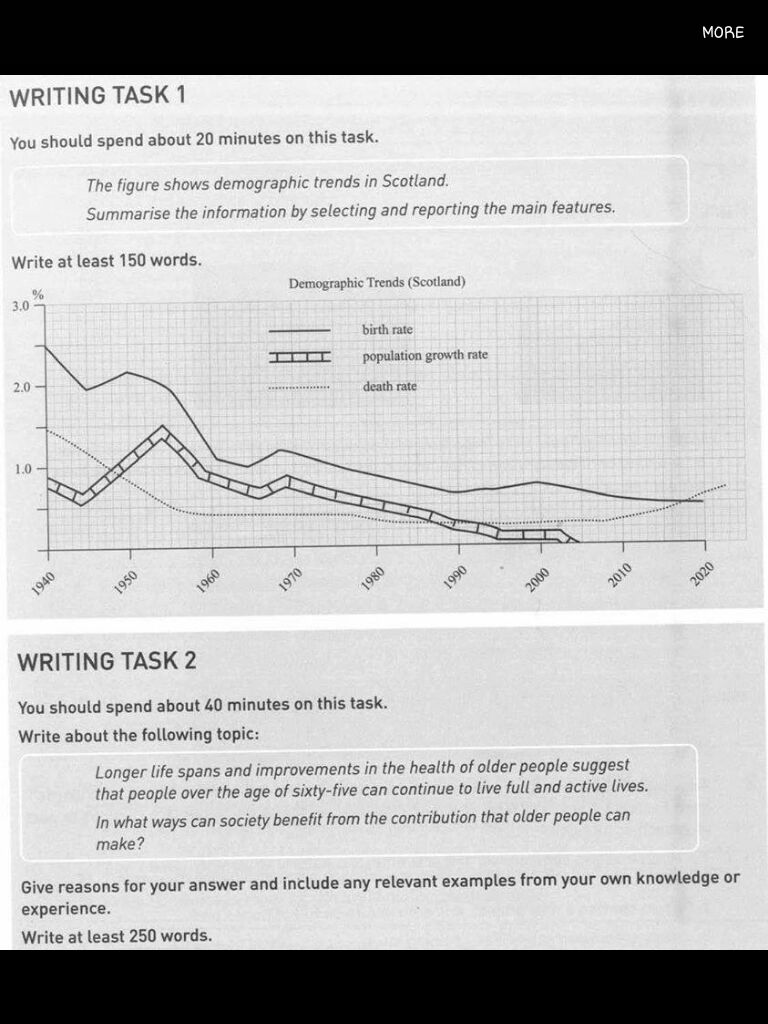
The line chart illustrates the changes of demographic trends in Scotland between 1940 and 2020. Generally speaking, birth rate dominated as the highest trend from 1940 to the present. Though all rates tended to decrease slowly in the past, death rate is predicted to show gradual rise.
At the beginning, birth percentage stood at about 2.5 % which was the peak point throughout 80 years while the others were at nearly 1.5% and 0.9% respectively. The resemblance trend was shown in the figure between the alteration of birth and population until 1990. It was true since they experienced decline fluctuation to below 0.8%. the moderate plunge to 0.4 percent and nearly steady changes was revealed in death rate before 2010.
2016 to 2020 witnesses the flip over trend for birth and death rate. Whilst death rate is projected to incline and reach over 0.7 percent, the other will remain constant at 0.5 percent. Interestingly, the population growth was the only category that dropped down to zero level.
CMIIW

IMG20160812WA0020.jpg
