Unanswered [1]
  

Home / Writing Feedback   % width   Posts: 2


IELTS Writing Task 1 - Describe a chart about average annual GDP growth


huy11804 1 / -  
May 15, 2021   #1

annual gross domestic product growth


I am using a book named Vocabulary for IELTS by Pauline Cullen and I am having an essay needed to check. The task is in the image. I hope that you can help me check all the mistakes in my writing and give me some feedback for how to improve this essay. Thank you very much for your help!

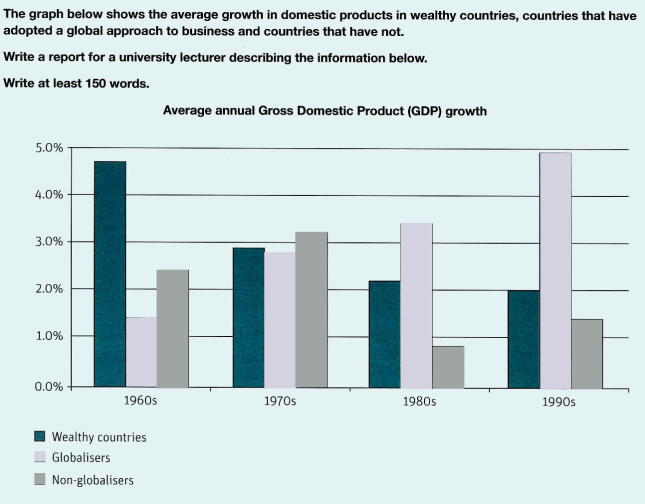
The chart shows the changes in the average annual Gross Domestic Product (GDP) of three groups of countries in the world during 1960s - 1990s period.

From the chart, we can see that wealthy countries' GDP dwindled from 4.8 percent in the 1960s to 2 percent in the 1990s. Noticeably, there is a significant decrease in the GDP of these well-off nations from 4.8 percent to 2.9 percent in 1960s - 1970s period.

Globalizers' national products, in contrast to those of rich countries, rose dramatically from about 1.3 percent to just under 4.9 percent at the end of this period. In addition, the fastest growth in this phase is in two final decades of the 20th century.

Non-globalizers had their peaks and troughs in domestic goods. From 2.4 percent in the 1960s, the GDP reached a peak of over 3 percent in the 1970s, but then quickly fell to a low of approximately 0.8 percent in the next decade and finally had a slight increase of 1.2 percent in the 1990s.

To recap, there is an upward trend in the GDP growth of globalizers, and there is a downward trend in the GDP growth of wealthy countries and non-globalizers.

  • IELTSWritingTask1.png


Holt  Educational Consultant - / 15461  
May 15, 2021   #2
*Please be advised that the reviews and advice given here will be alternate to advice given by the book author. The advice given herein are for students who are self studying and are open to the advice counter to or not found in your book. Advice given is based on the educational consultant experiences and teaching methods. Do not debate with the educational consultant based on the book author's teaching method. Accept this advice if you wish to do so, or not.

I find your summary overview to be incomplete. Based on the image, there are highlighted information that should have been presented in the first 3 sentences namely:

- measurement basis (types of countries, enumerated )
- complete image identification ( 3 bar graph presentation)
- single trending statement

While it is nice to know that you can use the word "percent" repeatedly, it also shows a lack of similar word usage on your part as you cannot use other words in its place. Lack of word variations for it within sentences isn't helping to add to the LR score. A task 1 essay does not need a recap, which is similar to a summary conclusion, as an opinion need not be presented to the audience.

Your formatting could have been better. A 3 paragraph presentation would have better served your c&c score. The essay does not require a 4 paragraph presentation based on the information provided. Which is why each paragraph seems under analyzed and reported in my opinion.

Again, I am not giving this advice to start a debate. I am not saying the author is wrong in anyway. My advice merely reflects my teaching method that has benefited my students. Take the advice as you wish to.


Home / Writing Feedback / IELTS Writing Task 1 - Describe a chart about average annual GDP growth
ⓘ Need Writing or Editing Help?
Fill out one of these forms for professional help:

Best Writing Service:
CustomPapers form ◳

Graduate Writing / Editing:
GraduateWriter form ◳

Excellence in Editing:
Rose Editing ◳

AI-Paper Rewriting:
Robot Rewrite ◳