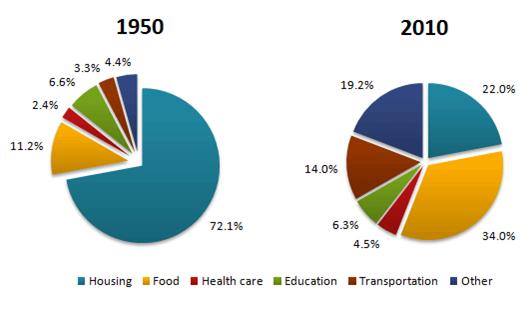
The pie charts below show the average household expenditures in a country in 1950 and 2010
A description of the percentage of local spending government over a 60-year period, between 1950 and 2010 is illustrated in pie chart. Overall, it is evident that, in 1950, housing saw just over seven in ten expenditure. There was a significant increase of spending Food and Transportation, while other expenditure witnessed a reverse.
To begin, in 1950, expenditure of Housing was the highest proportion in the local country, at 72.1%. Following this there was decreased dramatically to only 22% over more than a half century. Food was the second expenditure in early period at around one in ten then the figure increased significantly by more a third in the end of period.
Moving to health care, education, transportation and other were less than 20% expenditure in 1950. However, after 60 years spending of local country changed significantly, transportation rose sharply from 3.3 percent to 14.0 percent. Health care and education experienced a slight rise by 1.8%, astonishingly, other expenditure saw a sudden growth which only 4.4% in 1950 rise to 19.2% in 2010.

pie_chart_4.jpg
