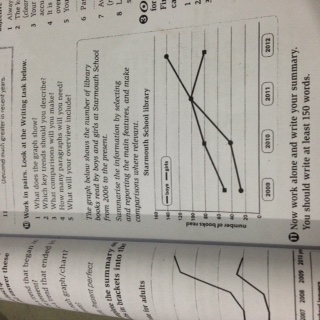
WRITING TASK 1 : THE NUMBER OF LIBRARY BOOKS READ AT SCHOOL
The graph gives information about gender which is getting involved in the number of library books read at Starmouth School for four years from 2009 to 2012 and is measured in number of books read. It is noticeable that, during four years, boys increased gradually in the first year, but fluctuated for three years later. Besides, girls increased dramatically until the end of period.
As can be seen from the graph, in 2009, the number books read stood at 50, which is experienced by men. The number then rose significantly from 2009 to 2011 at 100. After that, in the last period, the figure decrease gradually to 80.
On the other hand, women which is the figure of books read increased gradually from 30 to 40 between 2009 and 2010. Furthermore, the number a dramatic increase until the end of period at 140. Overall, boys was higher than girls in 2009 but there was an opposite trend in the last year which are girls higher than boys.

tas4.jpg
