eating chicken vs beef
The graph below shows the consumption of fish and some different kinds of meat in a European country between 1979 and 2004.
Summarize the information by selecting and reporting the main features, and make comparisons where relevant.
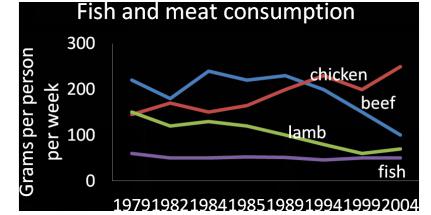
The graph compares the difference of consumption among chicken beef lamb and fish in a European country between 1979 and 2004.
According to the graph,in 1979 the consumption of beef was almost 230 grams per person per week,which was the highest among the four kinds of meat.In the meantime, the consumption of chicken and lamb were almost the same with each other in 1979(approximately 150 grams per person per week).The consumption of fish was the lowest which was probably 60 grams per person per week.
The consumption of fish barely changed during the twenty-five years,while the consumption of chicken has rose sharply to 250 grams per person per week in 2004.The consumption of beef and lamb dropped significant to 100 and 70 grams per person per week respectively in 2004.
We can also see from the graph that before 1990 the consumption of beef was higher than chicken.After 1990 the situation had changed.Moreover,in 1990 the consumption of lamb was dropped to 60 grams,almost as low as the consumption of fish.
In conclusion,people in the European country enjoyed eating chicken and beef between 1979 to 2004.

ez1.jpg
