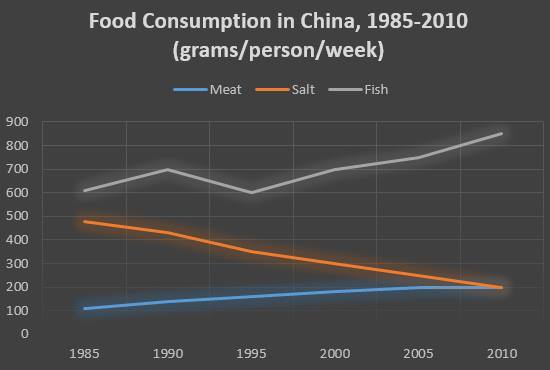
These graphs show the differences between three foods in China which is consumes each gram/person/week in period 1985 to 2010.
To sum up, the graphs show amount household consuming trend instability. Meat was gradual increased in the number by 10 percent in five year along periods from 1985 to 2010. Otherwise, Salt consuming jumped steeply from 500 at 1985 to around 200 grams/percent a week in 2010. Opposite, Fish is fluctuated in proportion consuming year by year.
In period 1985 to 1995, Meat consuming slow increased to number 150 gram. However, Salt dramatic decreased in the number 500 to 200 just over to 80 percent. In contrary has shown of Fish graph in the number fluctuated that was slowly increased from 600 gram slightly down in year 1995. Then dramatical increased in number from year 2005 to 2010. These line shown the differences between household consuming Meat, Salt and Fish in China along several years.

Writing_Task__China.jpg
