Question.
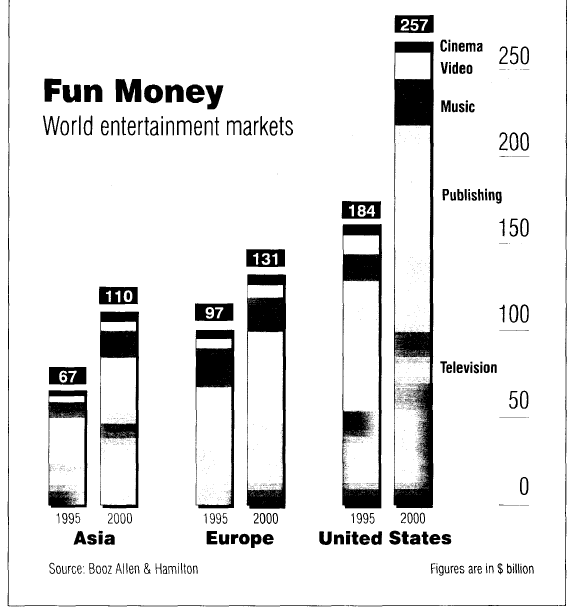
The graph below shows how money was spent on different forms of entertainment over a five- year period. Write a report for a university describing the information shown below.
The bar graph provided shows different amounts of money spend on various modes of entertainment by Asia, Europe and United States in the year 1995 and 2000.A quick overall view shows United states spends the highest amount of money in every field of entertainment with total amount of $ 257 billion in the year 2000.
In world entertainment market Asia spends the least of $67 to $110 billion in the years 1995 and 2000 respectively. Whereas in Europe equal amount of money was spend on cinema, videos and music in the years 1995 and 2000 but, interestingly expenditure in publication and television increased significantly by the year 2000 giving a rise in overall total of $ 34 billion.In United states except cinema all expenditure gradually increased making a significant rise in total money spend by the year 2000.
In conclusion money spend in cinemas was the only constant among all the three groups while other expenditures raised markedly from 1995 to 2000.

question_IELTS_writi.png
